Building a Mini SOC Environment: Segmentation, Telemetry, and Wazuh Integration
Why I Built This Environment
The real test of a SOC environment is not whether the tools install successfully. It is whether telemetry moves through the architecture cleanly enough to support investigation, parsing, and later detection logic. That was the problem this environment was built to solve.
I built this mini SOC lab to train in an environment that behaves closer to a real security operations workflow than a random collection of virtual machines. The goal was not to deploy tools for the sake of installation, but to understand how segmentation, telemetry collection, log forwarding, and centralized visibility behave when they are wired together as one monitored system.
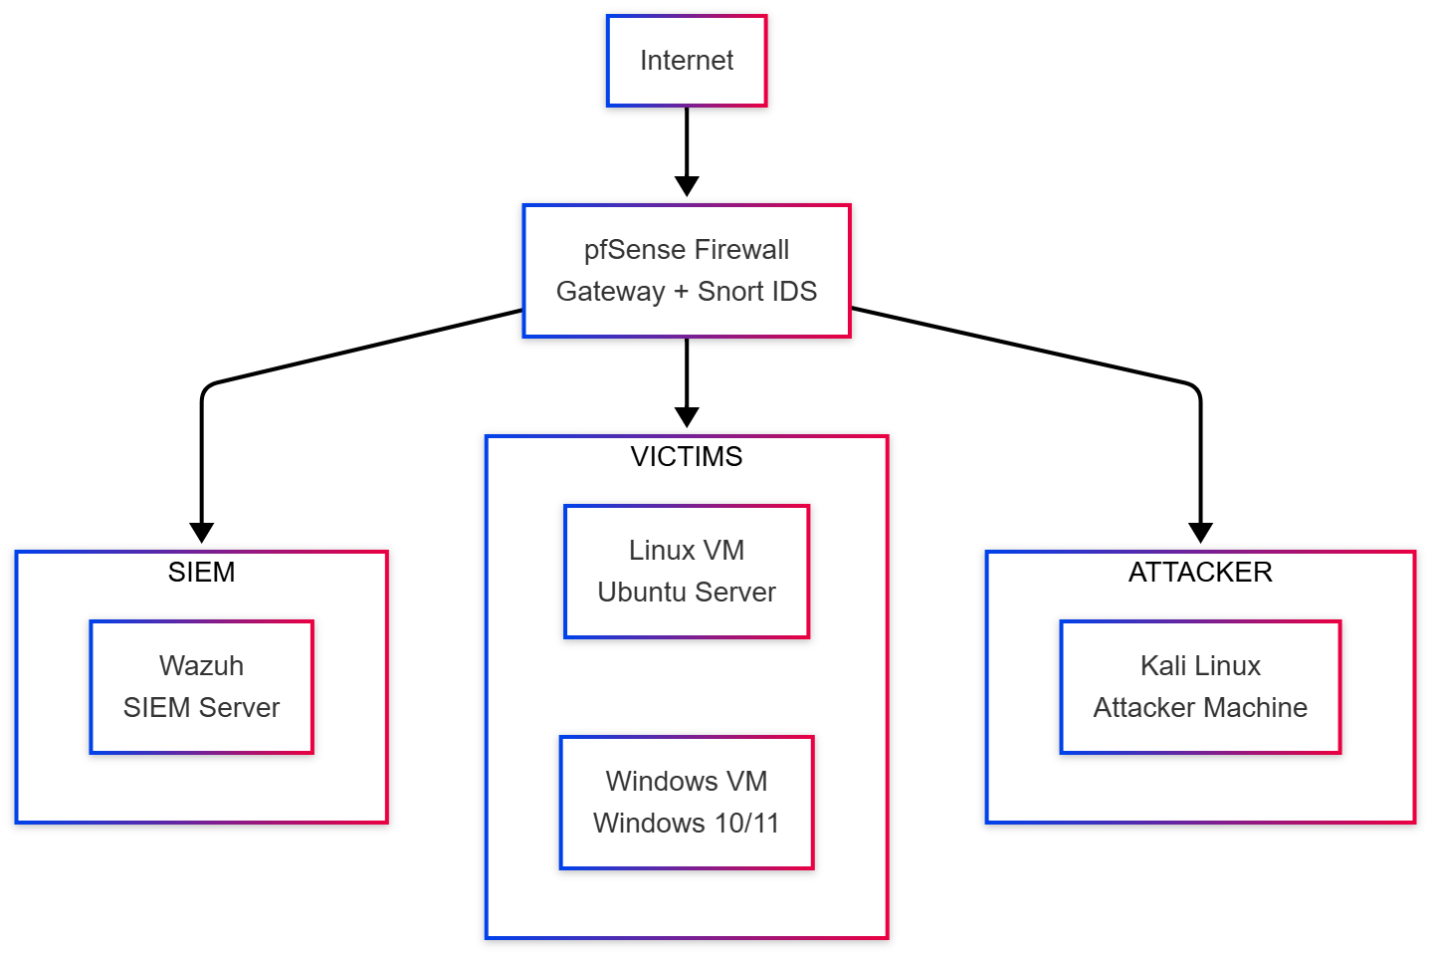
The lab was designed around three isolated segments, with pfSense acting as the control plane and Wazuh serving as the analysis layer.
The phase-1 success criteria for this environment were deliberately narrow:
- enroll both monitored endpoints successfully into Wazuh
- ingest firewall and gateway telemetry from pfSense into the SIEM plane
- confirm that IDS and host telemetry are visible enough to support later detection engineering
What This Series Starts With
This first post focuses on the foundation of the environment:
- architecture
- segmentation
- core tooling
- high-level integration
The stack used in this environment is straightforward on purpose:
pfSenseSnortWazuhWindows endpointDVWAKali Linux
Each component has a clear operational role, and the value of the lab comes from how these pieces interact rather than from the number of tools involved.
Architecture Overview
This lab was built on VMware Workstation Pro and, at this phase, consisted of five core virtual machines behind a segmented pfSense gateway. The target was not scale for its own sake, but a layout that preserved realistic traffic boundaries and useful telemetry paths.
The environment is split into three dedicated subnets:
| Segment | Subnet | Function |
|---|---|---|
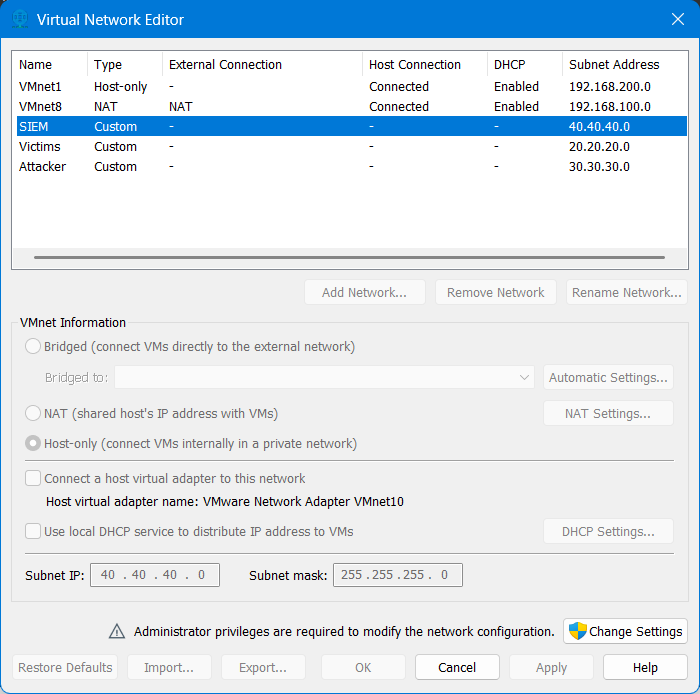
| SIEM | 40.40.40.0/24 | Centralized collection, analysis, and visibility |
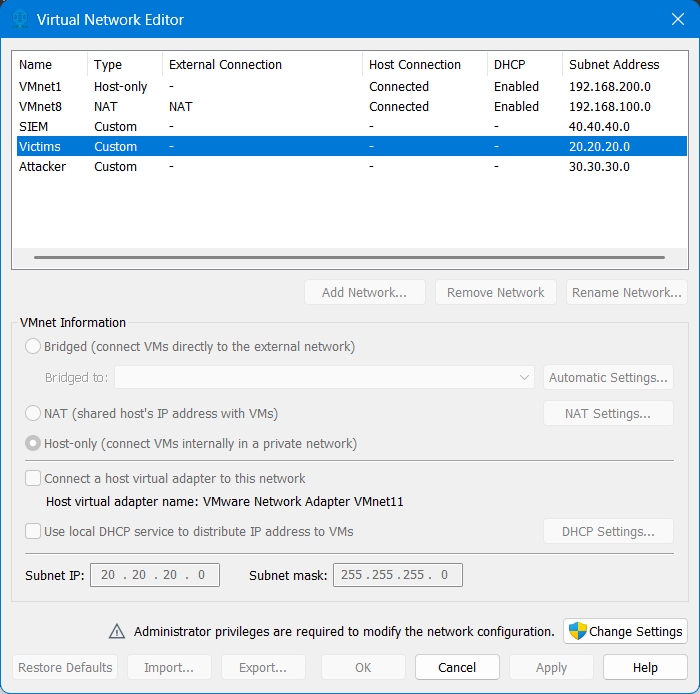
| Victims | 20.20.20.0/24 | Monitored workload segment |
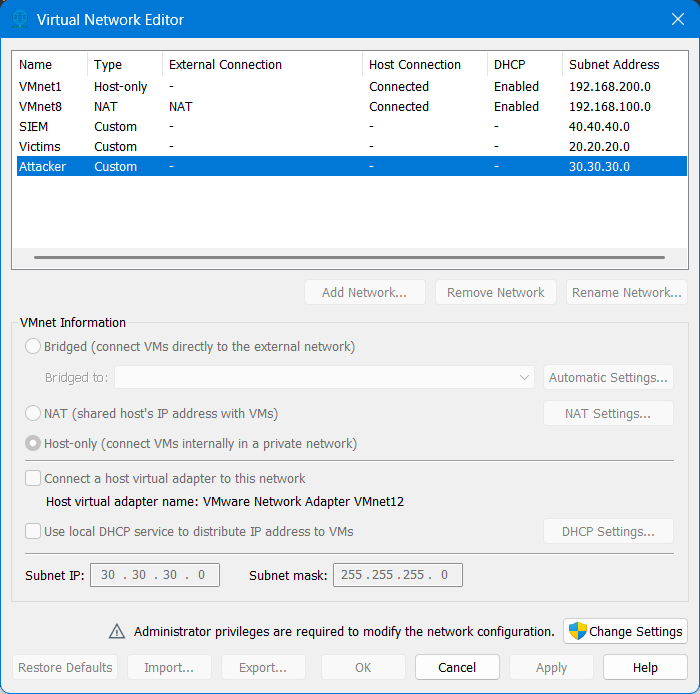
| Attacker | 30.30.30.0/24 | Controlled attack simulation segment |
pfSense sits between the networks and does more than routing. It enforces segmentation, handles DHCP, forwards syslog, and becomes the natural control point for moving telemetry from the network layer into Wazuh.
In this design, segmentation is not cosmetic. It exists to make traffic paths predictable, reduce ambiguity during analysis, and separate roles clearly:
- the SIEM network receives telemetry and hosts the analysis plane
- the victim network contains the systems being monitored
- the attacker network generates hostile activity in a controlled way
I intentionally treated the attacker as an internal hostile node instead of an internet-only source. That makes the environment much more useful for validating east-west visibility, firewall behavior, and attack traces that often matter in real internal investigations.
At a telemetry-path level, the model is simple and intentional: north-south and east-west traffic crosses pfSense, Snort inspects at the gateway, pfSense forwards network telemetry through syslog, endpoints forward host telemetry through the Wazuh agent channel, and Wazuh becomes the convergence point where those streams can be searched together.
The main hosts mapped into the lab were:
| Host | Role | Address |
|---|---|---|
wazuh | SIEM server | 40.40.40.5 |
pfSense | Gateway / firewall / syslog forwarder | 40.40.40.1, 20.20.20.1, 30.30.30.1 |
dvwa | Linux web target | 20.20.20.2 |
DESKTOP-35FAQ07 | Windows monitored endpoint | 20.20.20.3 |
kali | Attack simulation host | 30.30.30.2 |
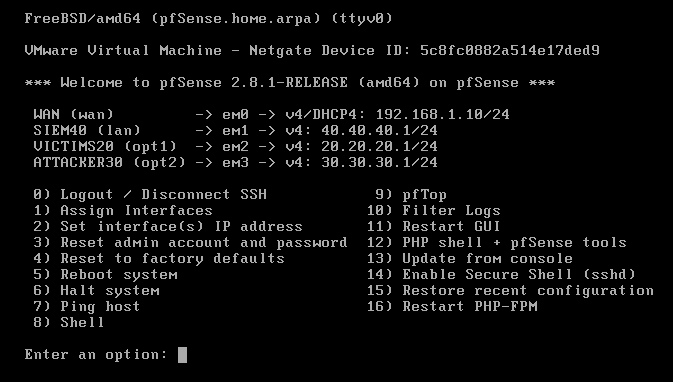
At the hypervisor layer, pfSense was attached to four adapters:
- one
WANinterface - one
SIEMinterface - one
Victimsinterface - one
Attackerinterface
That NIC layout made pfSense the single routing and enforcement point for the whole environment.
Design Constraints
This environment uses an all-in-one Wazuh deployment by design. For a lab-first phase, consolidating the manager, indexer, and dashboard on one Ubuntu node reduces deployment friction and keeps the architecture small enough to reason about while the telemetry paths are still being validated.
That simplification is intentional, not an implicit production recommendation. In practical terms, it comes with clear trade-offs:
- the SIEM node is a single point of failure in this phase
- horizontal scaling and cluster behavior are intentionally deferred
- performance tuning is not the priority yet; telemetry correctness is
- operational realism is focused on ingest and segmentation rather than on high availability
This is the right trade in phase 1 because the goal is to prove data movement and source onboarding first. Scale, resilience, and cluster complexity only become worth paying for once the basic ingest design is already correct.
Core Components
The environment is intentionally small, but each node has a precise job:
pfSenseprovides inter-network routing, firewall policy, DHCP, and remote syslog forwarding.Snortadds network intrusion visibility at the gateway layer.Wazuhacts as the central analysis platform, receiving both agent telemetry and forwarded network logs.- The
Windowshost provides endpoint visibility from a common enterprise operating system. DVWAprovides a Linux-based web target that can generate both host-side and application-adjacent events.Kaliprovides controlled attack traffic from a separate segment.
This matters because the lab is not just “Wazuh plus some targets.” It is an environment where host logs, firewall logs, and IDS output can coexist in one analysis surface.
Snort was attached at the gateway layer, which is exactly where I wanted network visibility to live in this environment: close to the routing and policy boundary rather than buried inside a single host.
Operationally, Snort was deployed as a pfSense package rather than being treated as a separate standalone sensor. That made the gateway the single enforcement and inspection point, which simplified both routing and event forwarding.
Telemetry Matrix
Before going deeper into deployment, it helps to make the ingest design explicit. This is the telemetry model the lab was built around in phase 1:
| Source | Telemetry type | Collection method | Transport | Destination | Expected operational result |
|---|---|---|---|---|---|
pfSense | system, firewall, DHCP, package events | remote syslog forwarding | UDP/514 | Wazuh manager 40.40.40.5 | gateway-side activity becomes searchable in Wazuh |
Snort on pfSense | NIDS alerts written into pfSense logging path | pfSense package logging + syslog forwarding | UDP/514 via pfSense | Wazuh manager 40.40.40.5 | IDS observations reach the same analysis plane as firewall telemetry; field-level parser validation comes next |
DESKTOP-35FAQ07 | baseline Windows endpoint telemetry | Wazuh agent | secure TCP/1514 | Wazuh manager 40.40.40.5 | host enrollment and Windows event visibility are confirmed |
dvwa | baseline Linux host telemetry | Wazuh agent | secure TCP/1514 | Wazuh manager 40.40.40.5 | Linux endpoint enrollment and host visibility are confirmed; Apache/application log onboarding is deferred |
Wazuh authd | agent registration traffic | Wazuh enrollment service | TCP/1515 | Wazuh manager 40.40.40.5 | endpoints can register without manual key exchange |
In other words, this phase validates two parallel ingest paths:
- network telemetry enters through pfSense syslog forwarding
- host telemetry enters through Wazuh agent enrollment and secure transport
That split is operationally important because it defines where parsing and troubleshooting should happen later. If a firewall event is missing, the syslog path is suspect. If a host event is missing, the agent channel or endpoint configuration is suspect.
Phase-1 Source Coverage
This first stage validates transport and baseline visibility, not full source expansion.
pfSenseforwarding is in scope in this phaseSnortalert transport through the pfSense logging path is in scope in this phase- Windows baseline event visibility through the Wazuh agent is in scope in this phase
- Linux baseline host visibility through the Wazuh agent is in scope in this phase
- Apache access/error log onboarding on the DVWA host is intentionally deferred
- expanded Windows channels such as
SysmonandPowerShell Operationalare intentionally deferred
That distinction matters because a connected endpoint is not automatically a fully onboarded endpoint. Phase 1 proves enrollment and transport. Deeper source coverage comes after the ingest paths are stable enough to trust.
Network Design and Traffic Logic
The traffic policy was designed to support testing without collapsing the isolation model.
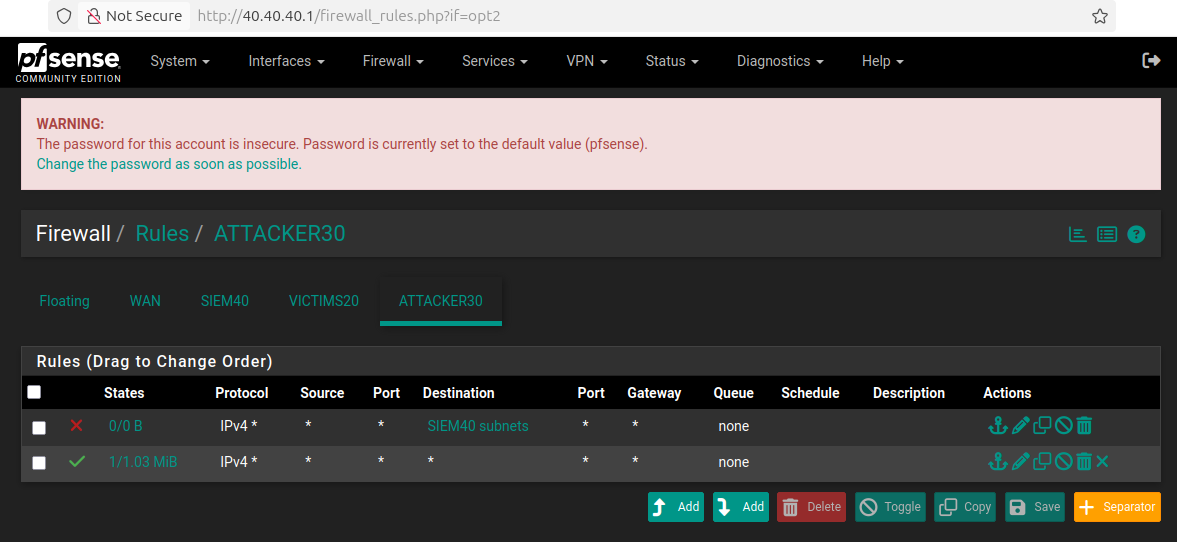
Victims -> SIEM: allowedVictims -> Attacker: allowedSIEM -> Victims: allowedSIEM -> Attacker: allowedAttacker -> Victims: allowedAttacker -> SIEM: blocked
That last rule is the important boundary. I wanted the attacker segment to generate traffic freely against monitored systems, but I did not want direct reachability into the SIEM plane.
From a hardening perspective, the SIEM plane was treated as a protected management segment even in a lab context. The most important control was the explicit block from Attacker -> SIEM, but the security posture of the management surface is worth calling out directly:
- the dashboard and manager services live on the SIEM subnet rather than the victim or attacker segments
- the SIEM-facing rules were kept narrow enough to support management and ingest, not arbitrary attacker reachability
UDP/514was used for pfSense syslog in this phase as a lab simplification to keep forwarding simple and compatible with the gateway workflow- secure endpoint telemetry still used the Wazuh agent channel over
TCP/1514, so host-side ingest was not downgraded to plaintext syslog
If this were being hardened toward production, the next discussion would be transport integrity for syslog, tighter source scoping, management-access minimization, and stronger separation between operational administration and telemetry ingestion. For phase 1, the focus stayed on proving the ingest path with the fewest moving parts possible.
From an engineering perspective, the communication paths that mattered most were:
- victim hosts to Wazuh manager over the agent channel
- pfSense to Wazuh over remote syslog
- Snort events written into the logging path that Wazuh ingests
- attacker traffic toward victims for simulation and validation
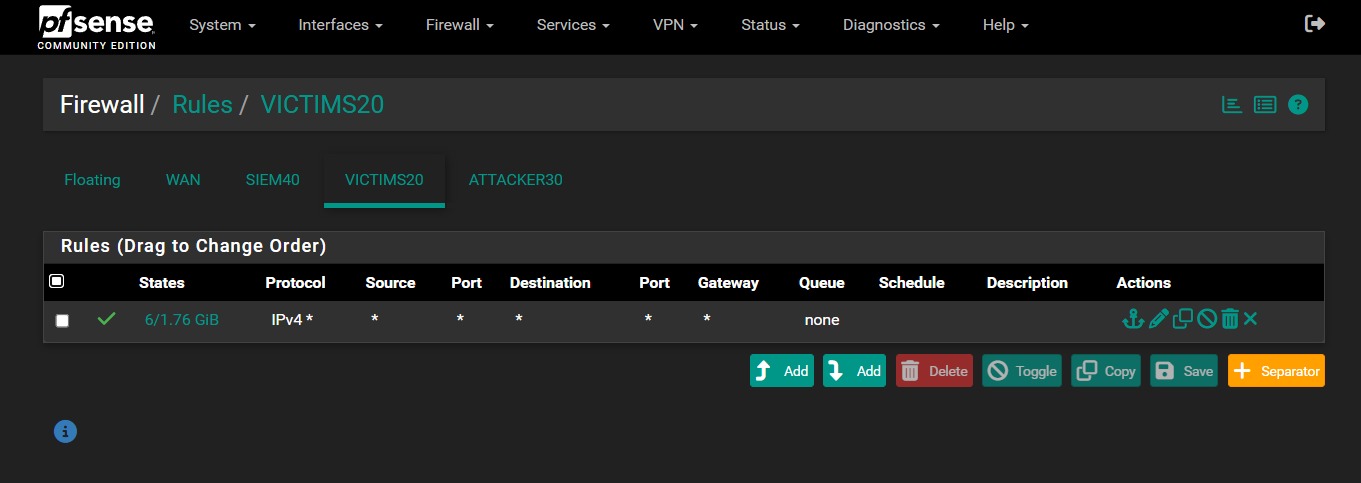
The firewall policy on pfSense reflected that model. The attacker side was allowed to interact with the victim subnet, while access to the SIEM subnet was explicitly denied.
The interface assignments on pfSense mapped cleanly to the segmented design, which made policy reasoning much easier during both setup and troubleshooting.

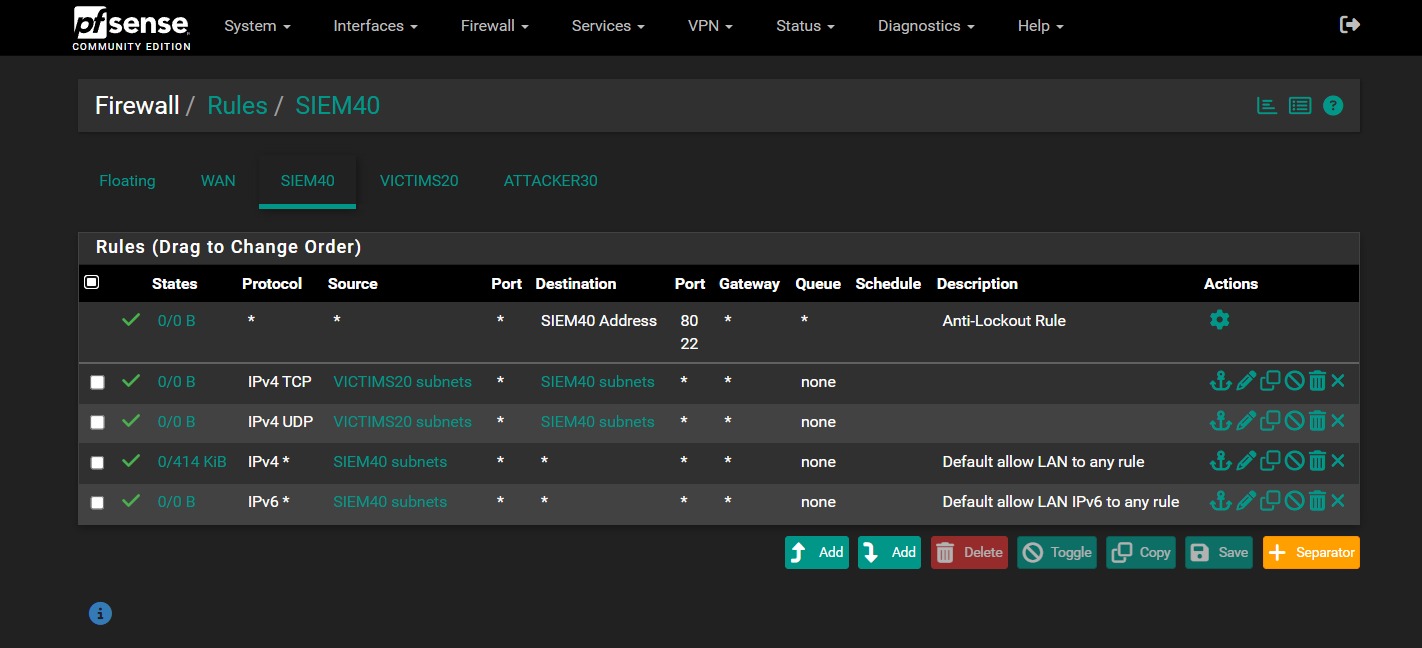
The SIEM and victim interfaces were also configured to support the telemetry path and normal lab operations:
- the SIEM interface accepted traffic required for management and ingestion
- the victim interface remained permissive enough to support agent communication and test traffic
- no aliases were used in this version of the lab
On the SIEM side, the rule set explicitly allowed traffic from the victim subnet into the SIEM subnet over both TCP and UDP, while still preserving the built-in anti-lockout path for pfSense management. On the victim side, the policy stayed intentionally permissive to avoid breaking endpoint communication during the early integration phase.
Remote address assignment was handled from pfSense as part of the segmented design, which kept the addressing model simple and centralized.
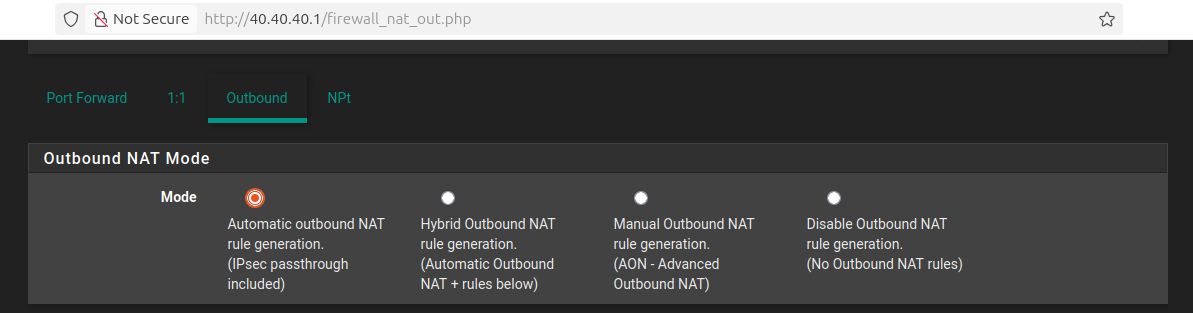
Automatic outbound NAT was left enabled to keep package installation and initial service connectivity predictable during the early build stage.
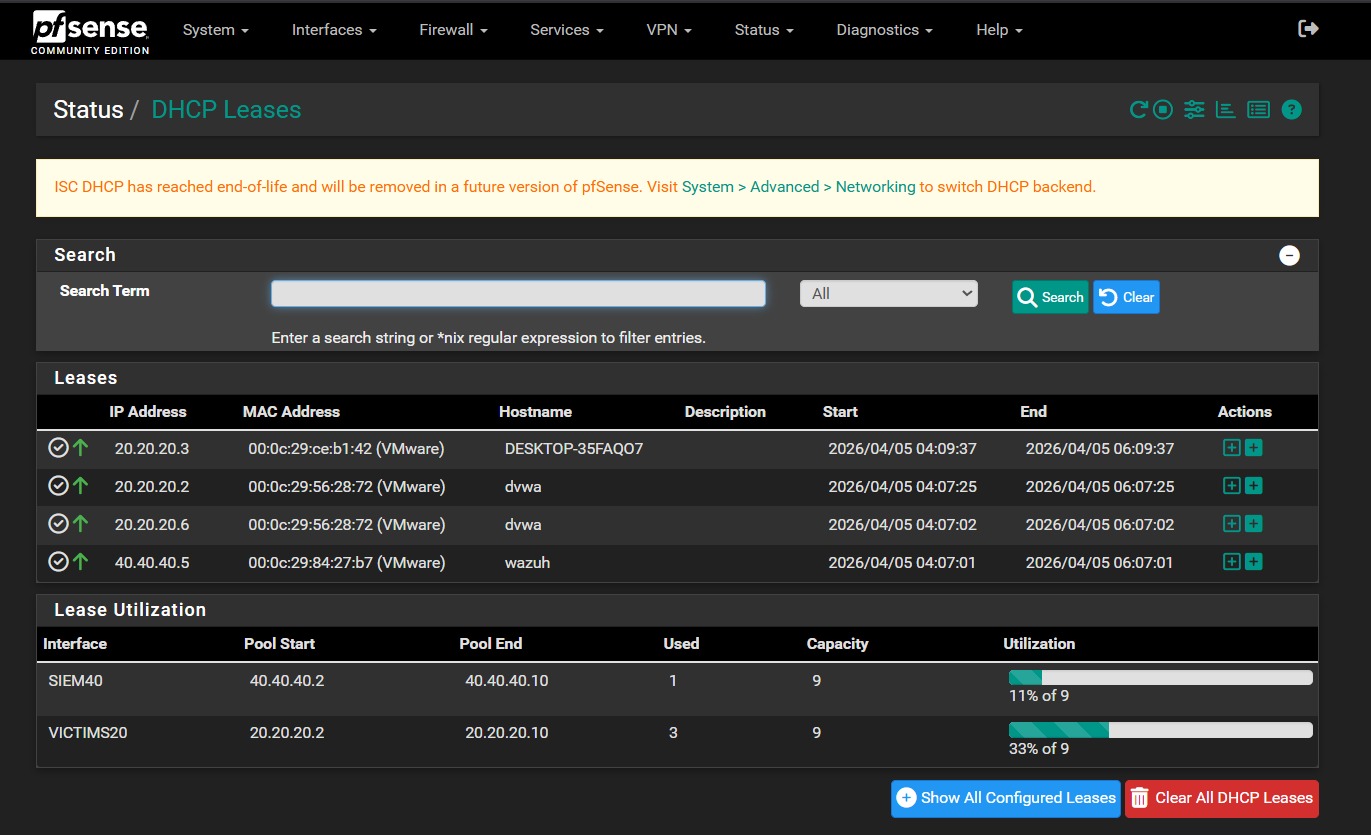
DHCP also stayed centralized at the gateway. In practice, the SIEM lease space was served from 40.40.40.2-40.40.40.10, while the victim lease space was served from 20.20.20.2-20.20.20.10. That gave me deterministic addressing for the core hosts without having to hardcode every node manually from the beginning.
High-Level Setup Flow
I built the environment in the following order, and the sequence mattered because each stage depended on the previous one being stable.
1. Created the VMware custom networks
The first step was building the three isolated VMware networks that represented the SIEM, victim, and attacker zones. Until those segments existed, nothing else in the lab had a reliable place to live.
2. Deployed pfSense and mapped interfaces
The pfSense VM was created as a FreeBSD 64-bit guest and brought online with four NICs. After the base install, the interface mapping was kept simple:
WAN: DHCPLAN1 / SIEM:40.40.40.1/24LAN2 / Victims:20.20.20.1/24LAN3 / Attacker:30.30.30.1/24
That gave the environment a real control plane before I started attaching monitored systems.
3. Configured DHCP and segmentation
Once pfSense was online, DHCP was enabled on the internal LANs and the segmentation policy was enforced through interface-specific rules. That was the point where the network stopped being a virtual wiring exercise and started behaving like an actual environment.
4. Installed Wazuh
For the SIEM node, I used Ubuntu and deployed Wazuh as an all-in-one installation. In this lab phase, that was the right choice because I wanted one host to provide the indexer, server, and dashboard roles without introducing cluster complexity too early.
On the Ubuntu host, the installation flow was straightforward:
1
2
curl -sO https://packages.wazuh.com/4.14/wazuh-install.sh
sudo bash ./wazuh-install.sh -a
The installer handled the central components and printed the dashboard access details when the deployment finished. After installation, I validated the generated credentials and kept the dashboard reachable from the SIEM segment.
1
sudo tar -O -xvf wazuh-install-files.tar wazuh-install-files/wazuh-passwords.txt
Once the stack was online, the next checks were simple but important:
- confirm that the dashboard loaded correctly over HTTPS
- confirm that the manager, indexer, and API were responsive
- confirm that the server was ready before moving to agent enrollment
Because this was a lab environment, the Wazuh quickstart installer was an efficient way to get a fully functional analysis stack online before tuning integrations and rules. Wazuh documents this assisted installation flow in its official quickstart for supported Ubuntu versions. Wazuh Quickstart
5. Brought up the Windows victim
The Windows system was attached to the victim subnet and used as the primary monitored endpoint for host telemetry and later authentication-focused validation.
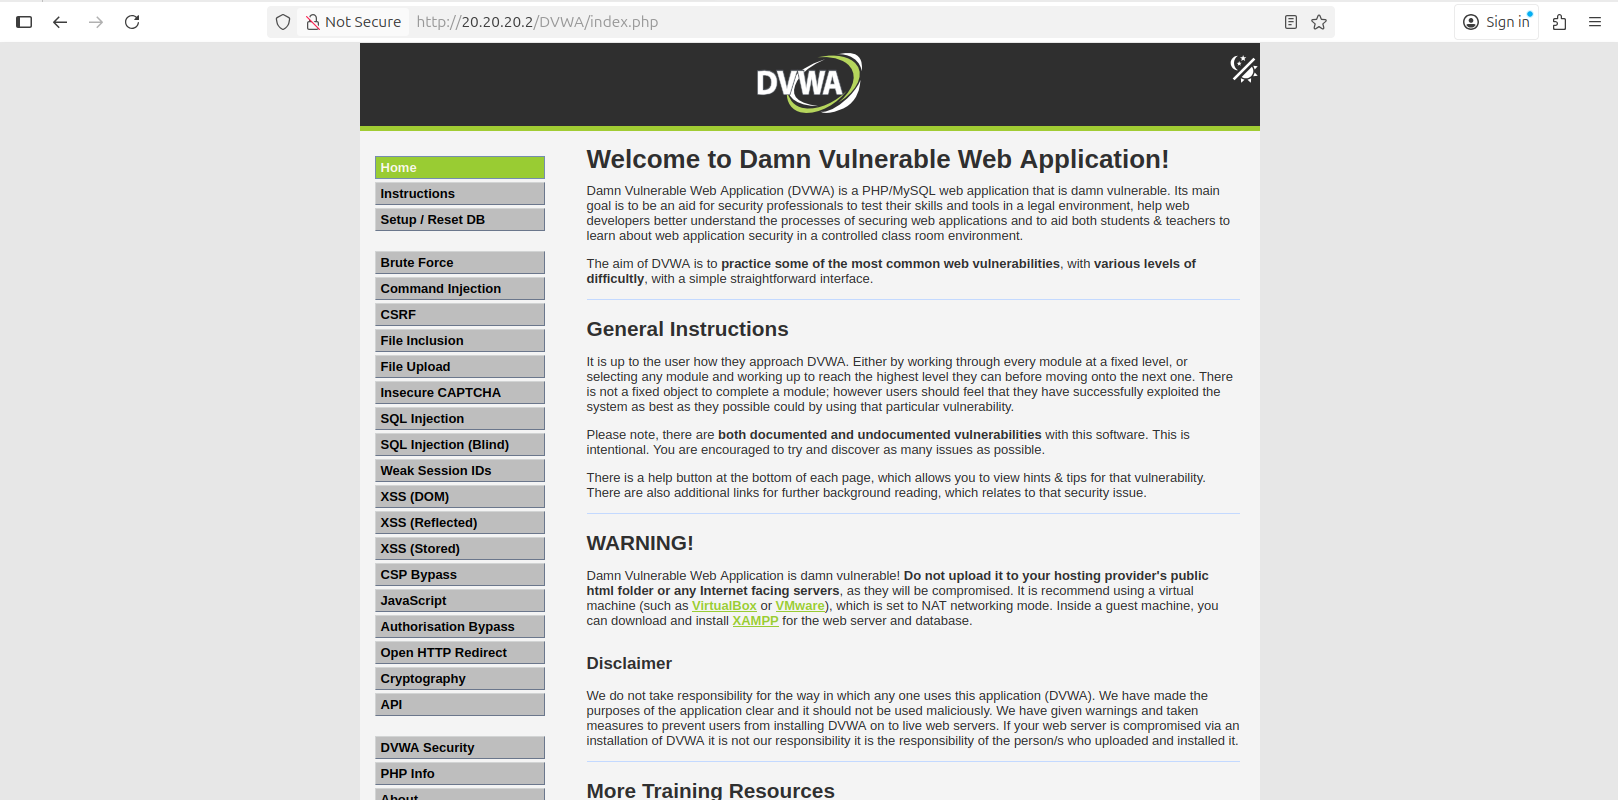
6. Deployed DVWA
The DVWA host was placed in the same victim segment and prepared as the Linux-based web target.
The setup path was:
1
2
3
4
5
6
sudo apt update
sudo apt install apache2 mysql-server php php-mysqli git -y
cd /var/www/html
sudo git clone https://github.com/digininja/DVWA.git
sudo chown -R www-data:www-data DVWA
sudo systemctl enable --now apache2 mysql
At that point, the application was reachable on the victim subnet and ready to generate host-side and web-side telemetry.
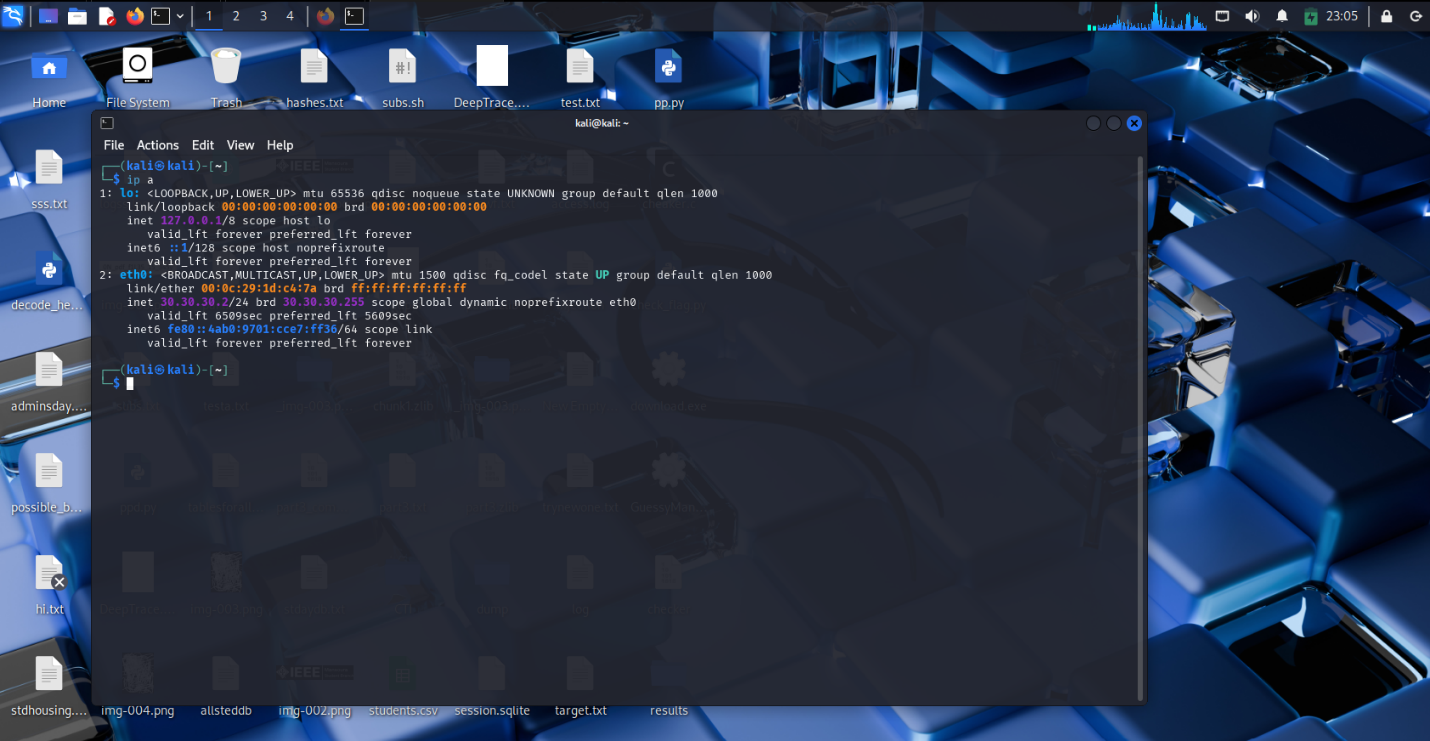
7. Added Kali
The Kali host was attached to the attacker subnet and used as the controlled source of scans and attack traffic against the victim environment.
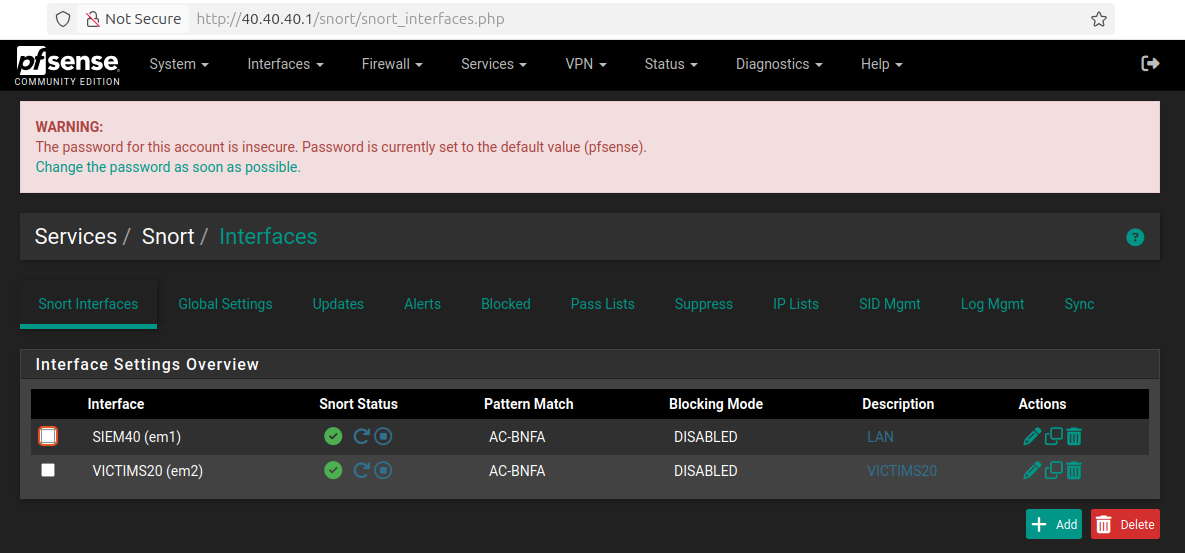
Snort package deployment
One practical detail here is that Snort installation happened from the pfSense package workflow after the core interface layout was already stable. I preferred doing that after the gateway was routable and segmented, because IDS inspection is only useful once the traffic paths are already correct.
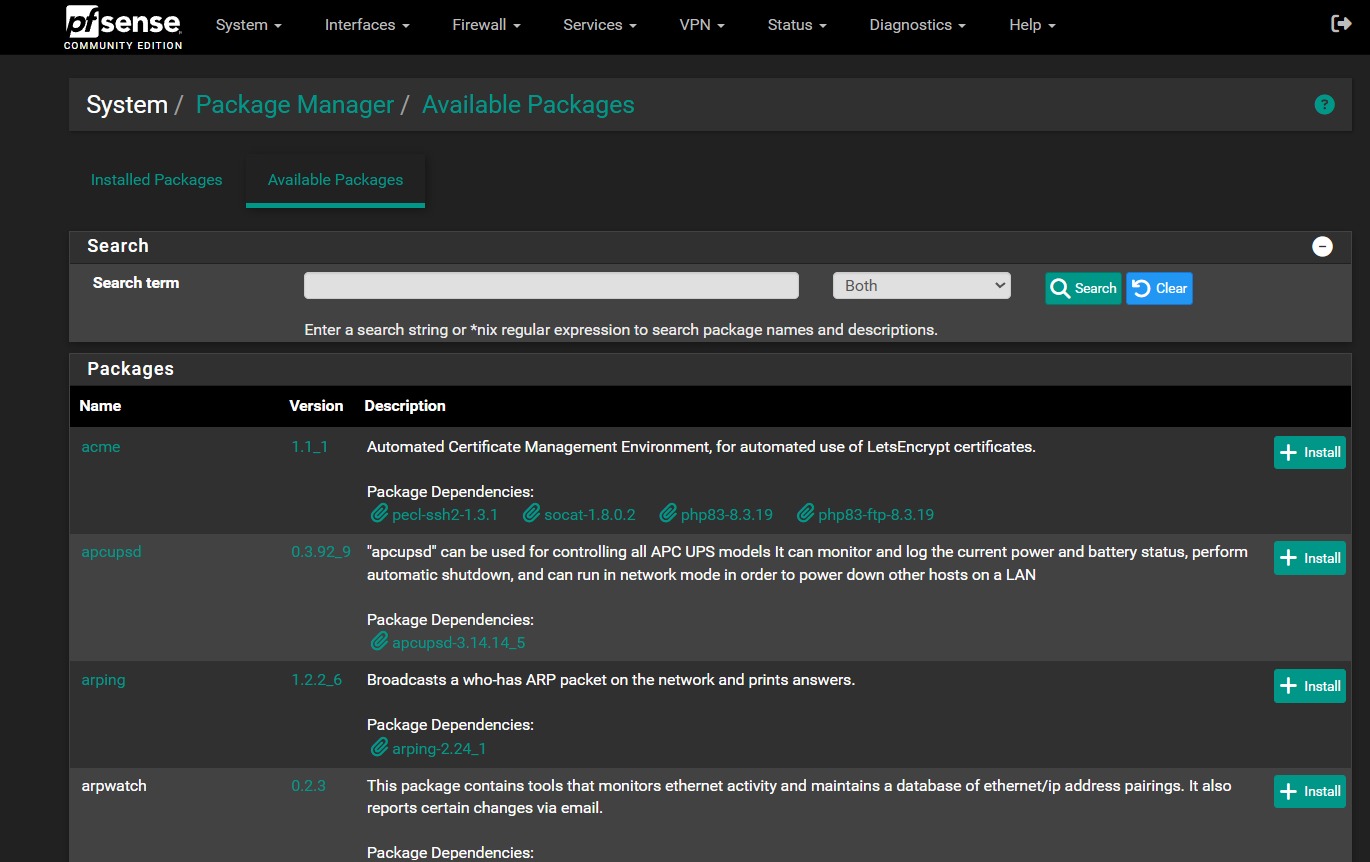
The practical Snort deployment workflow was:
- open
System -> Package Manager - install
Snort - attach it to the relevant interfaces
- enable sending alerts to the system log so Wazuh could ingest them through the pfSense syslog path
That kept inspection aligned with the gateway instead of scattering network visibility across hosts.
This section is intentionally an engineering walkthrough, not a full rebuild runbook. The exact runbook flavor still exists in the original project documentation through the installation resources, package paths, DHCP ranges, and procedural steps. Here, I am biasing toward design intent and operational reasoning rather than reproducing every installer click exactly as a checklist.
Agent Installation and Enrollment
Once the network and central platform were stable, the next step was turning the endpoints into trusted telemetry sources for the manager at 40.40.40.5.
This is worth separating from later detection engineering. Agent installation is the setup phase: establish trust, register the endpoint, and confirm that events can move over the secure channel. Tuning extra sources such as Sysmon, PowerShell Operational, or Apache access logs comes after that baseline connection already works.
At this stage, host enrollment was validated, but advanced source onboarding was intentionally deferred. That means the phase-1 objective was to prove that Windows and Linux endpoints could register, connect, and send baseline telemetry. Additional coverage such as expanded Windows channels or application-specific Linux log onboarding belongs to the next layer of ingest work rather than to the first connectivity milestone.
Enrollment model used in this lab
I aligned the deployment to Wazuh’s official package-based agent workflow for both Windows and Linux, but I replaced the documentation examples with the real manager address and host identities from this environment. The package guides Wazuh publishes for Windows and Linux both support installation and enrollment through deployment variables, which fit this lab well.
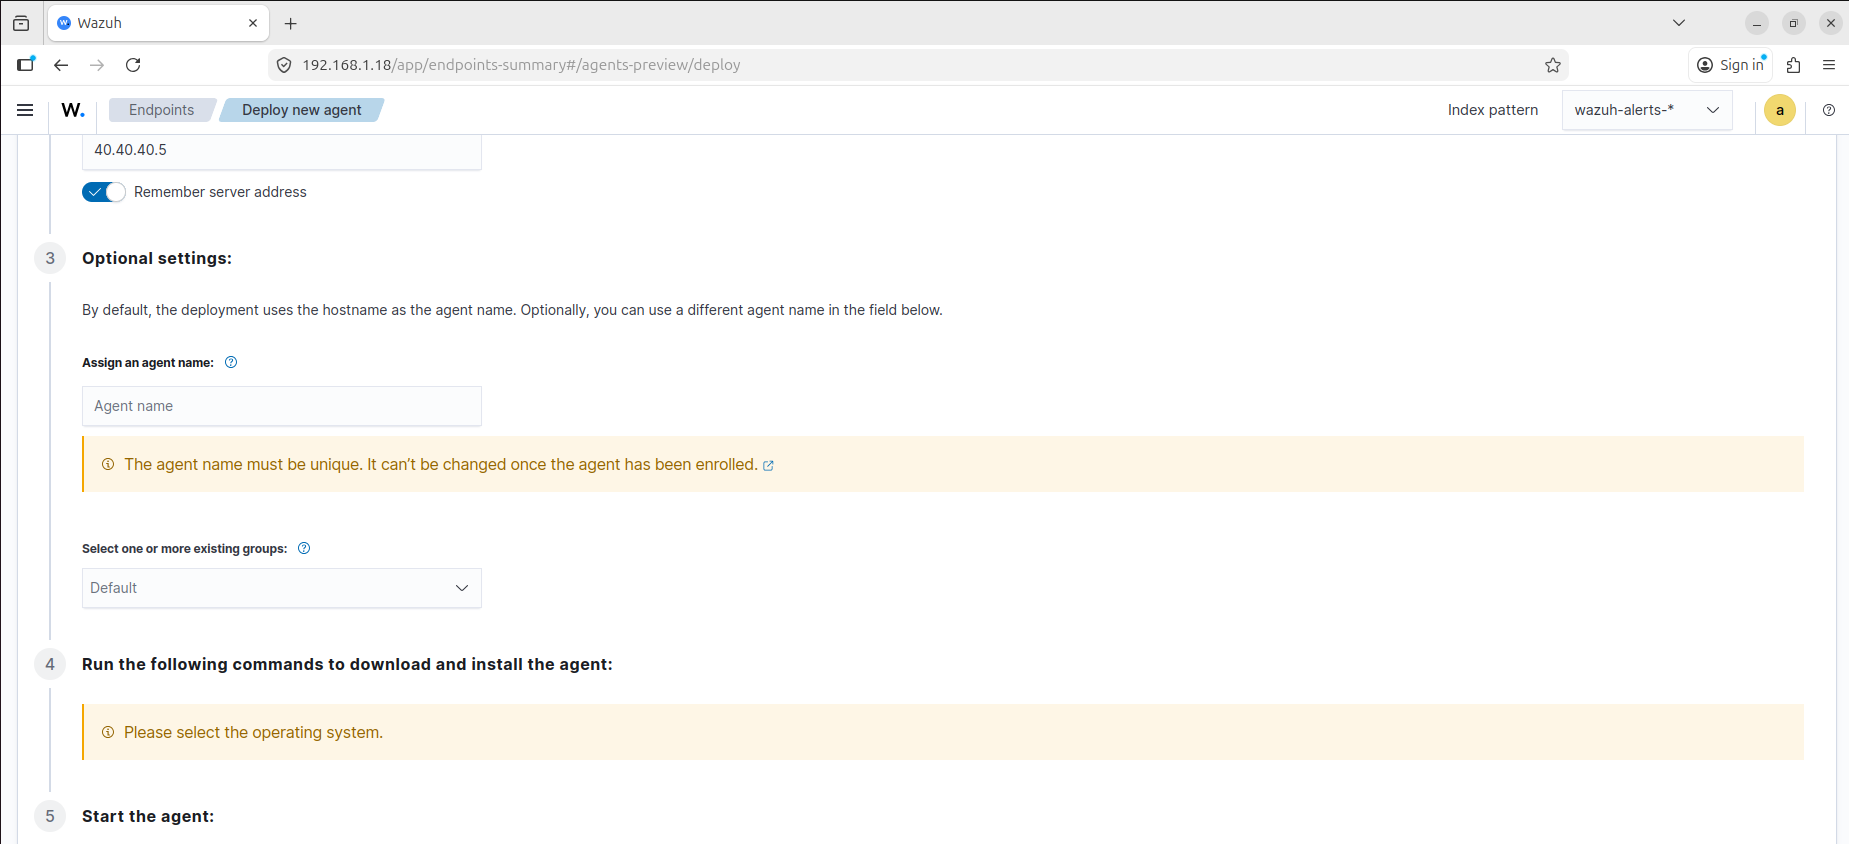
Before installing the agents on the endpoints, I used the dashboard-driven deployment flow as the reference path from the manager itself. That made it easier to keep the enrollment target, host naming, and generated install commands aligned to the SIEM node.
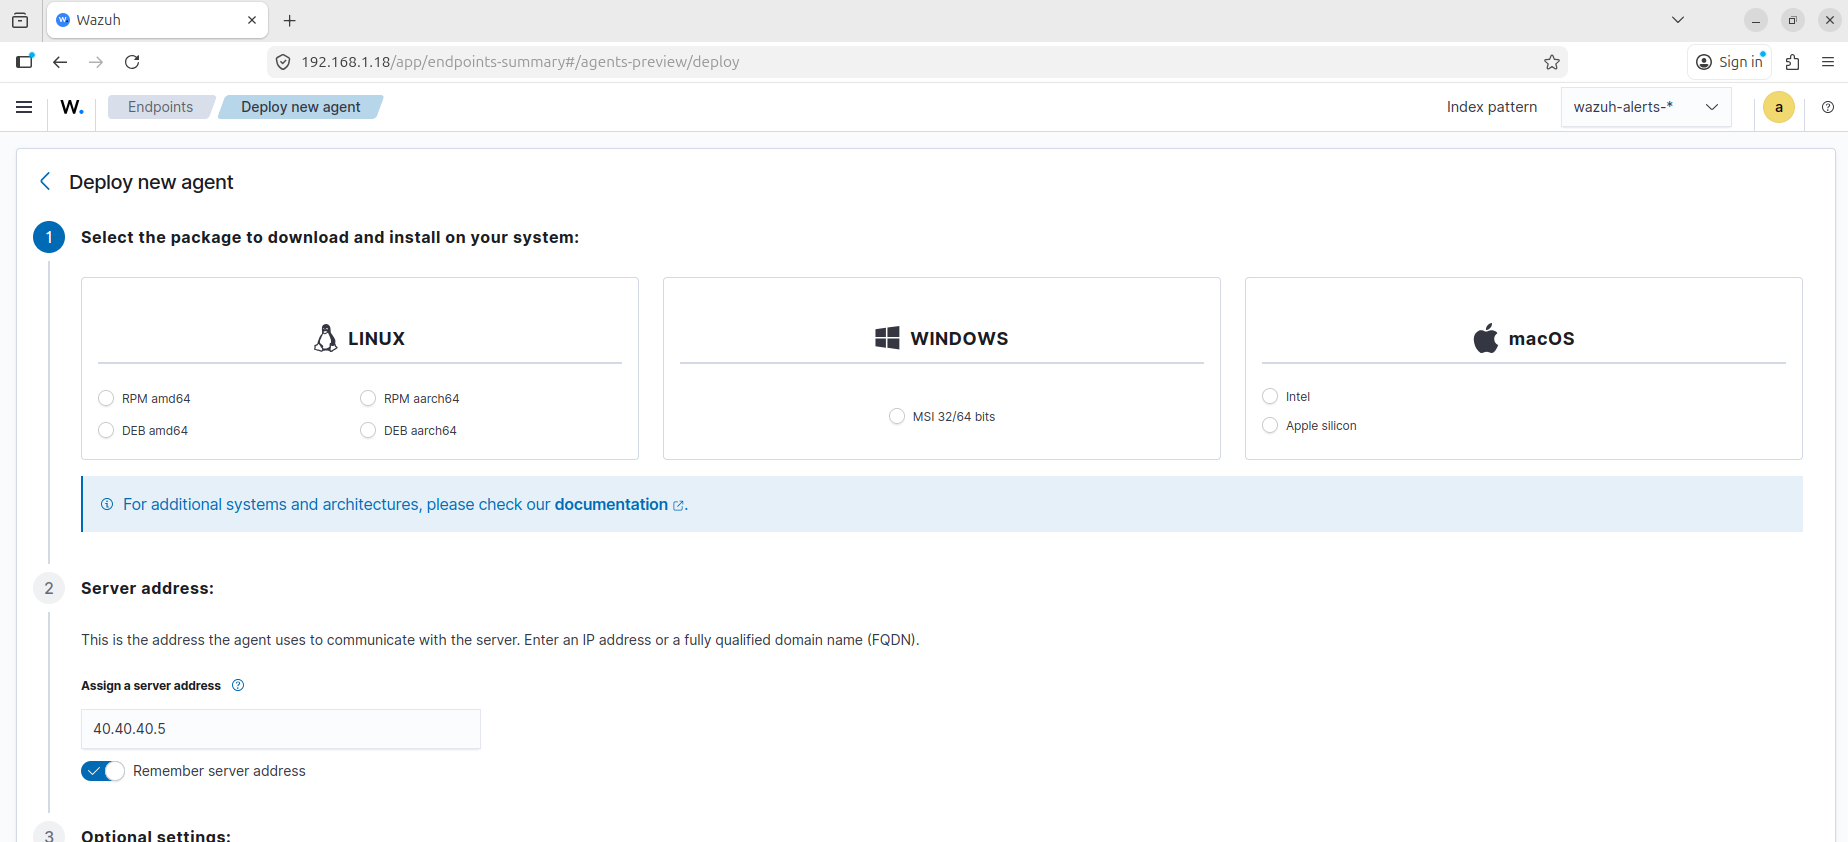
The manager-side configuration was exposed directly through the Wazuh settings interface, which made it possible to verify the transport and enrollment options from the dashboard before testing the endpoints themselves:
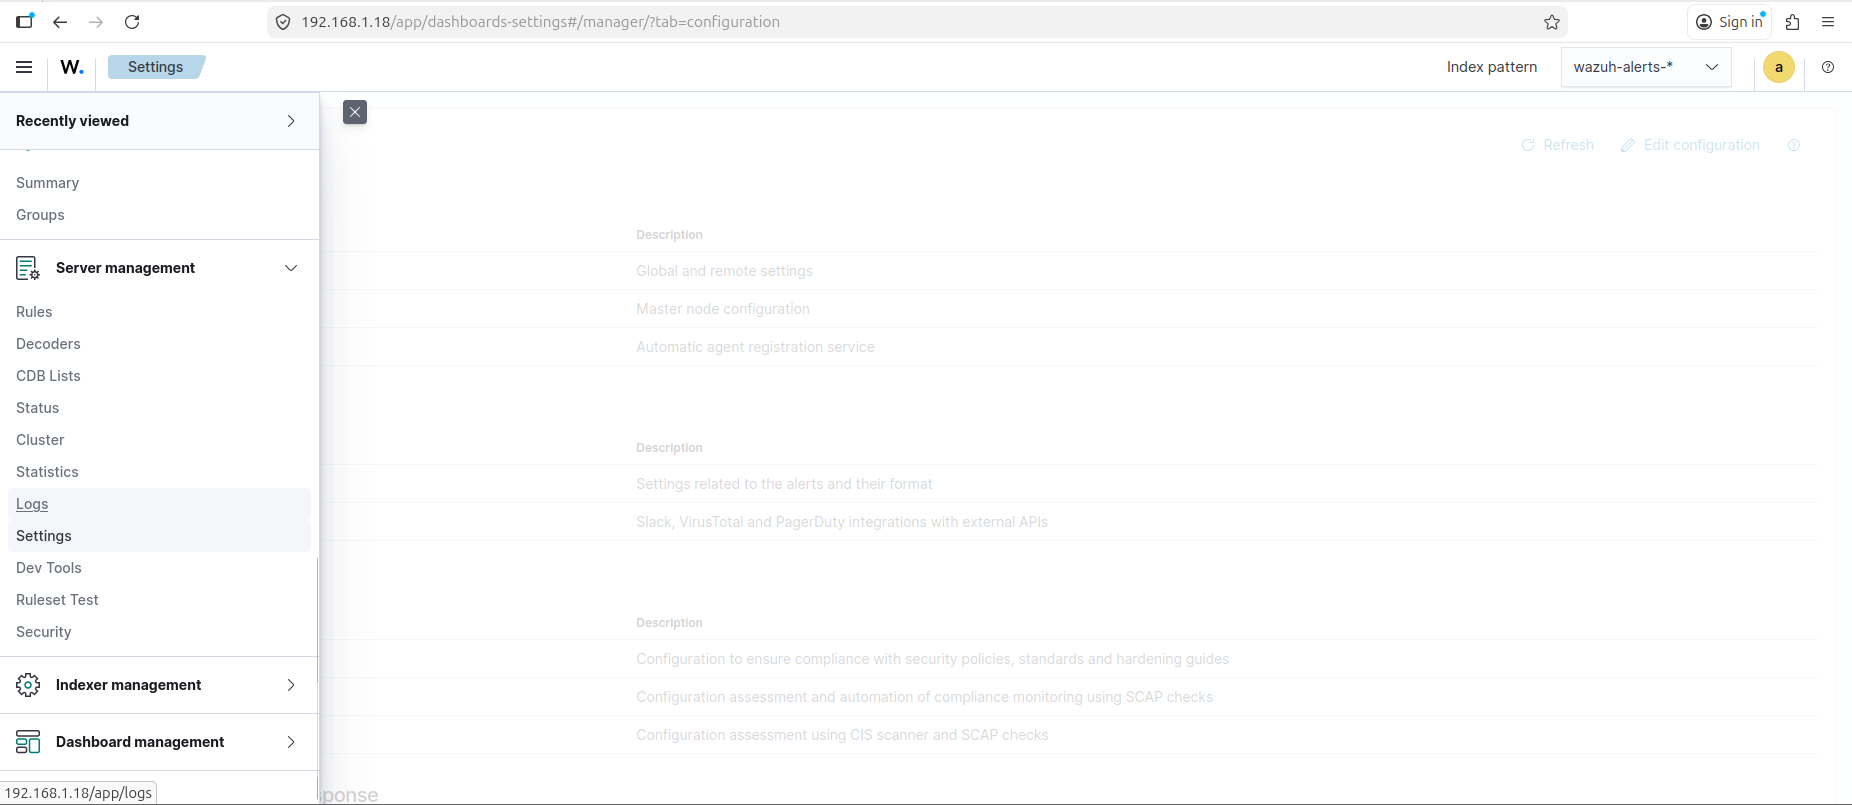
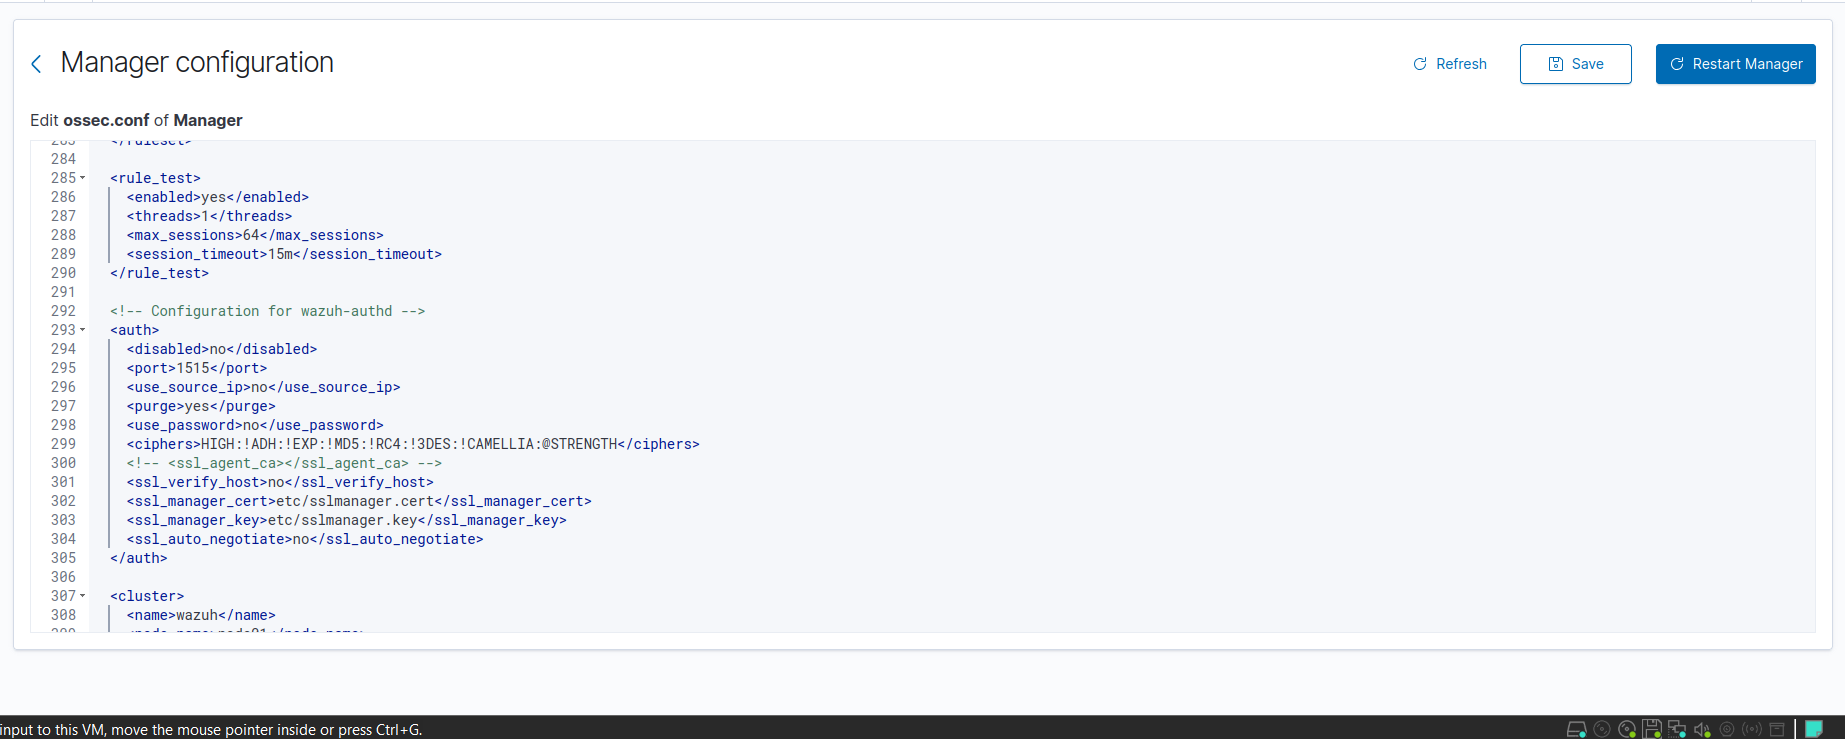
On the manager side, the relevant ossec.conf settings were already in place:
1
2
3
4
5
6
7
8
9
10
11
12
13
<remote>
  <connection>secure</connection>
  <port>1514</port>
  <protocol>tcp</protocol>
  <queue_size>131072</queue_size>
</remote>

<auth>
  <disabled>no</disabled>
  <port>1515</port>
  <use_password>no</use_password>
  <ssl_verify_host>no</ssl_verify_host>
</auth>
Those blocks are the pieces that mattered for enrollment:
1515/tcpaccepted the agent registration request1514/tcpcarried the encrypted event stream after registrationuse_passwordstayed disabled in this lab, so I did not need a separate registration password
That means the lab used automatic enrollment through the Wazuh manager service, not a manual key exchange with manage_agents, and not a separate agent-auth flow.
Windows agent
For the Windows endpoint, I followed the official Wazuh MSI deployment flow and adapted the example to the victim host in this lab. The current Wazuh documentation shows the same workflow with a newer package version, but my environment was running the 4.13.1 agent shown in the dashboard screenshots.
The deployment command was:
1
2
.\wazuh-agent-4.13.1-1.msi /q WAZUH_MANAGER="40.40.40.5"
Start-Service wazuhsvc
That was enough to install the agent silently, point it at the SIEM node, and bring the Windows service online. The endpoint then enrolled under its real host name, DESKTOP-35FAQ07, which made correlation much easier later because the identity in Wazuh matched the identity on the host.
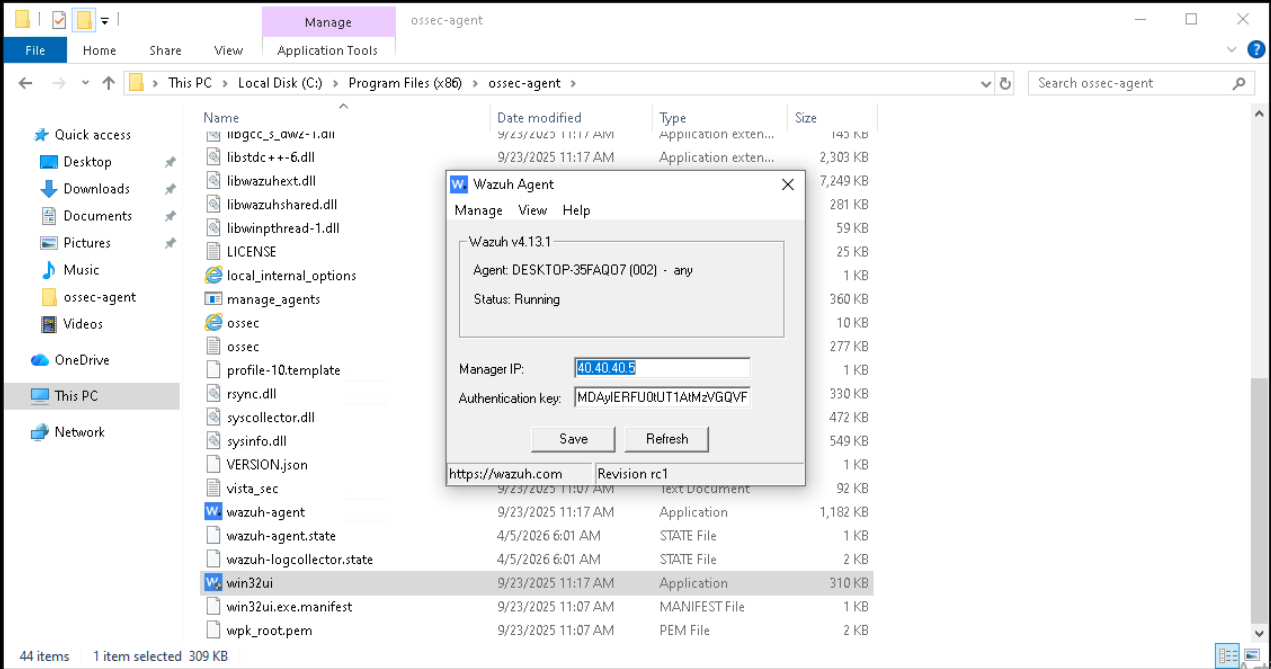
The agent files live under C:\Program Files (x86)\ossec-agent, and the relevant manager binding is reflected in the agent configuration there:
1
2
3
4
5
6
7
<client>
  <server>
    <address>40.40.40.5</address>
    <port>1514</port>
    <protocol>tcp</protocol>
  </server>
</client>
From a validation perspective, the important proof was not just that the package installed. The real checks were:
- the Windows service started successfully
- the agent appeared as
activein the Wazuh dashboard - the manager began receiving Windows telemetry from that endpoint
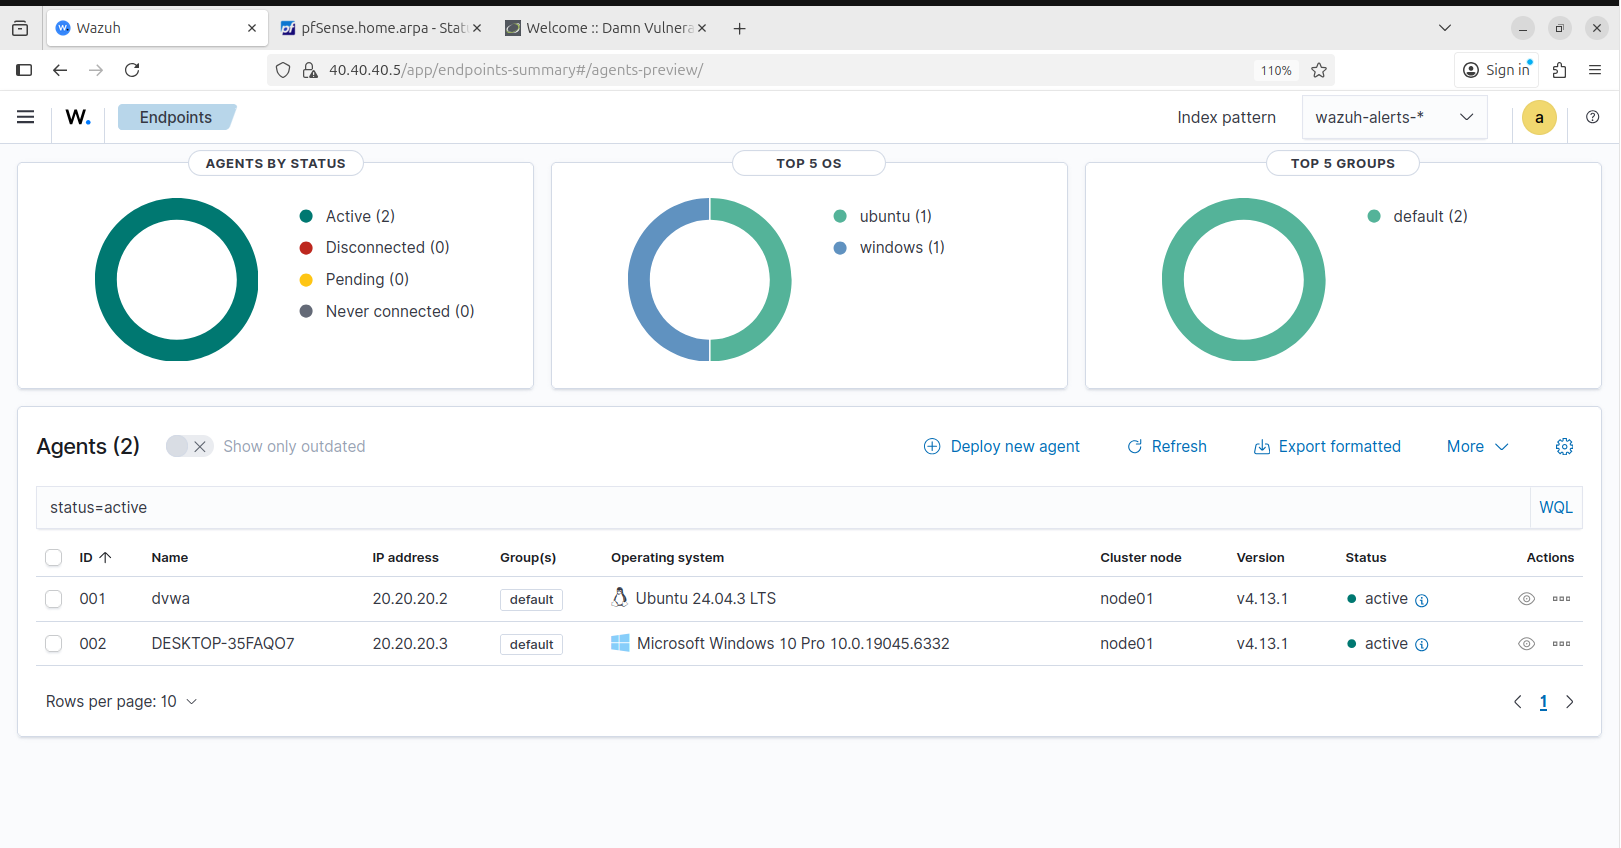
The active agent view shows that DESKTOP-35FAQ07 came online from 20.20.20.3 and stayed connected:
From the endpoint side, the local Wazuh agent interface also confirmed that the Windows system was bound to 40.40.40.5 and running correctly:
The telemetry proof is stronger than the connection proof. The screenshot below shows Windows events arriving from DESKTOP-35FAQ07, which confirms that the endpoint was not merely registered but was already forwarding usable data into Wazuh:
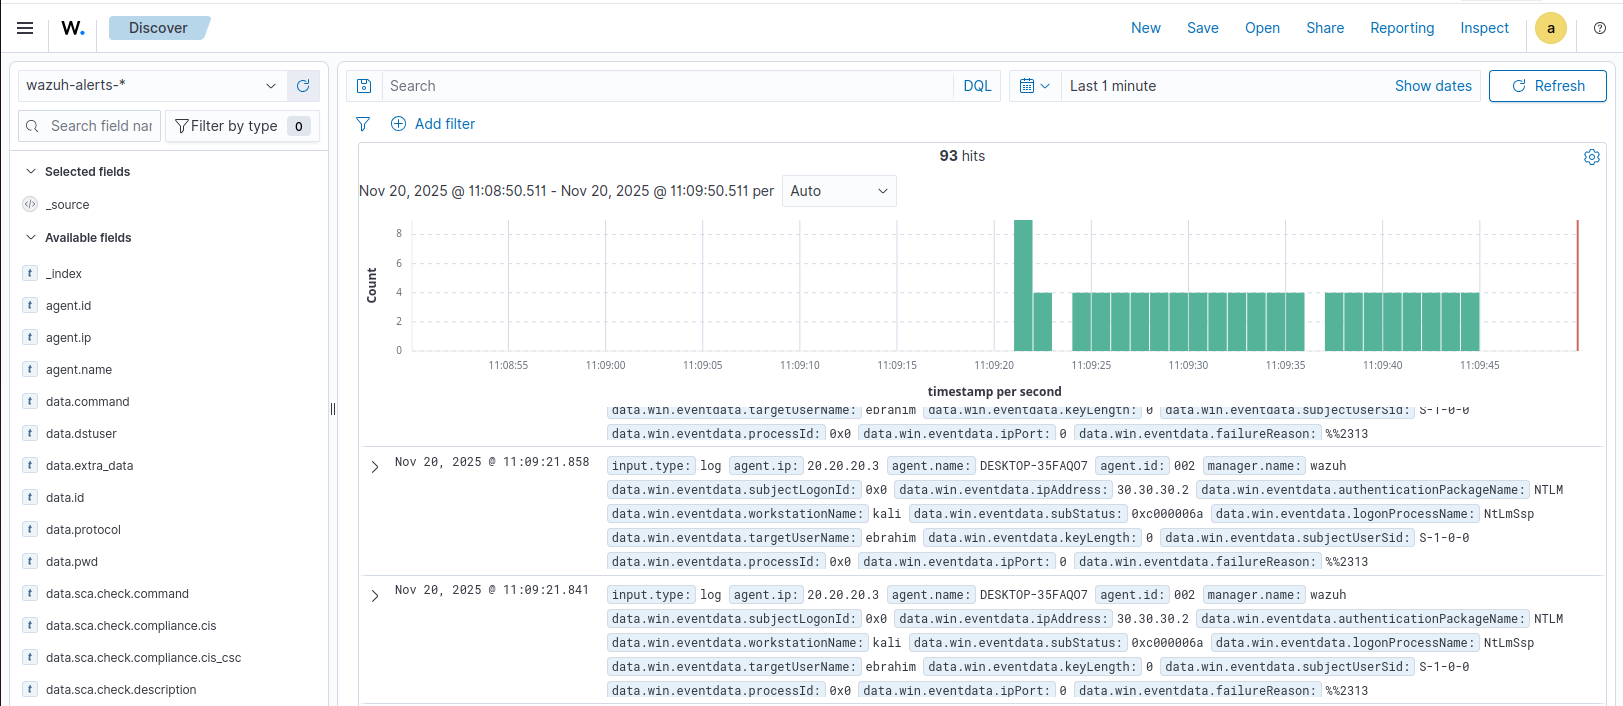
Wazuh’s Windows log collection guidance notes that System, Application, and Security event channels are monitored by default on Windows, while additional channels such as Microsoft-Windows-Sysmon/Operational and Microsoft-Windows-PowerShell/Operational can be added later through localfile blocks in ossec.conf. In this first post, I treat that as telemetry expansion rather than as the installation step itself. The base requirement here was proving that the agent was connected and that Windows event data was already reaching the manager.
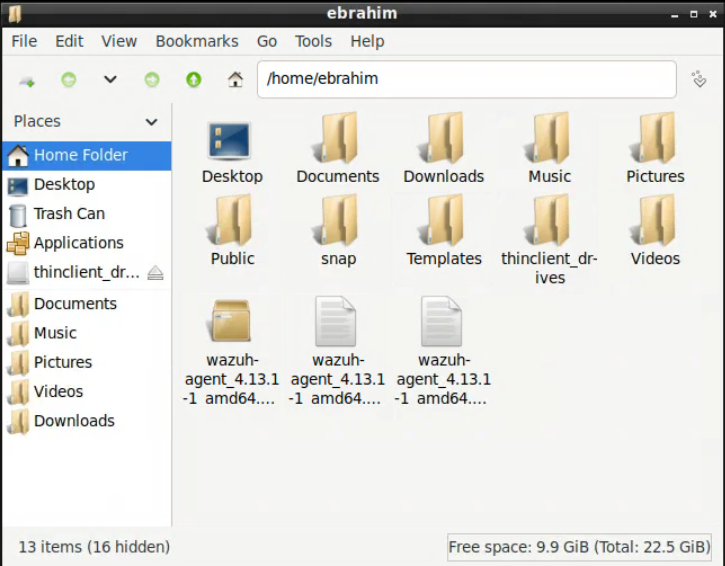
Linux / DVWA agent
For the Linux endpoint, I used the official Debian/Ubuntu package workflow and replaced the sample manager IP with the SIEM address used in this lab:
1
2
3
4
5
6
7
8
9
10
11
sudo apt-get install gnupg apt-transport-https
curl -s https://packages.wazuh.com/key/GPG-KEY-WAZUH | \
gpg --no-default-keyring --keyring gnupg-ring:/usr/share/keyrings/wazuh.gpg --import
chmod 644 /usr/share/keyrings/wazuh.gpg
echo "deb [signed-by=/usr/share/keyrings/wazuh.gpg] https://packages.wazuh.com/4.x/apt/ stable main" | \
sudo tee -a /etc/apt/sources.list.d/wazuh.list
sudo apt-get update
sudo WAZUH_MANAGER="40.40.40.5" apt-get install wazuh-agent
sudo systemctl daemon-reload
sudo systemctl enable wazuh-agent
sudo systemctl start wazuh-agent
This deployed the agent on the dvwa host and enrolled it against the same manager without needing a separate manual registration step. As with Windows, the agent-side configuration was straightforward. The relevant part of /var/ossec/etc/ossec.conf is the manager binding:
1
2
3
4
5
6
7
<client>
  <server>
    <address>40.40.40.5</address>
    <port>1514</port>
    <protocol>tcp</protocol>
  </server>
</client>
That was enough to make the Linux host visible as agent 001 with the name dvwa. In the active agents view, the endpoint appears from 20.20.20.2, which confirms that the Linux side completed enrollment and stayed connected over the secure channel:
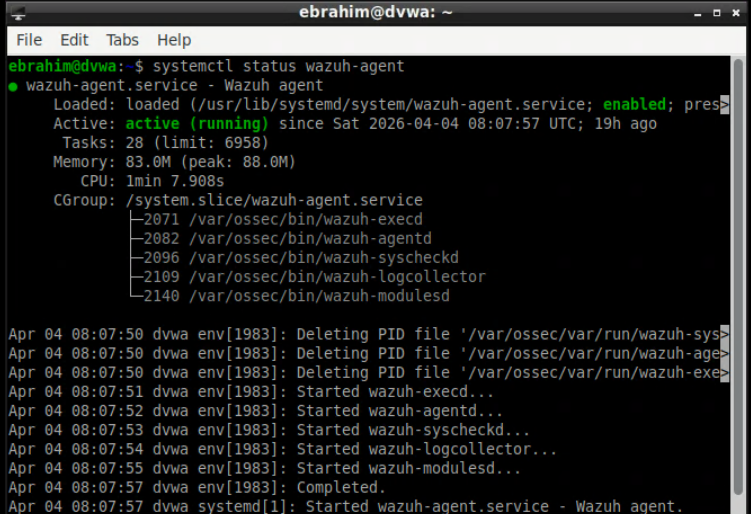
At the Linux endpoint itself, I kept the proof chain simple: the package was present on the host, and the wazuh-agent service was enabled and running under systemd.
Because this host also ran the DVWA web stack, it is easy to blur host enrollment with application log onboarding. I kept those as two different concerns. The agent installation itself only needed the secure manager connection to work. If Apache access or error logs are added later, that happens through extra localfile entries in /var/ossec/etc/ossec.conf and should be validated separately with application-log evidence inside Wazuh.
That means the DVWA host is already a valid Linux telemetry source in this post, but not yet a fully onboarded web telemetry source. From a SOC perspective, that is an intentional scope boundary rather than an omission by accident.
Setup proof vs. detection proof
This distinction matters for the rest of the series:
- setup proof means the agent installed, enrolled, connected, and stayed active
- telemetry proof means the manager actually received events from the endpoint
- detection logic comes later, when additional channels, log files, decoders, and rules are tuned on top of that working transport
In this lab, the setup proof is the active-agents view and the manager-side 1514/tcp plus 1515/tcp configuration. The telemetry proof is the Windows event data already visible in Discover. That is the point where the environment stopped being “installed” and became operational enough to support later detection work.
Integration: How the Pieces Were Actually Connected
This is where the lab stopped being a collection of configured systems and started behaving like a SOC environment.
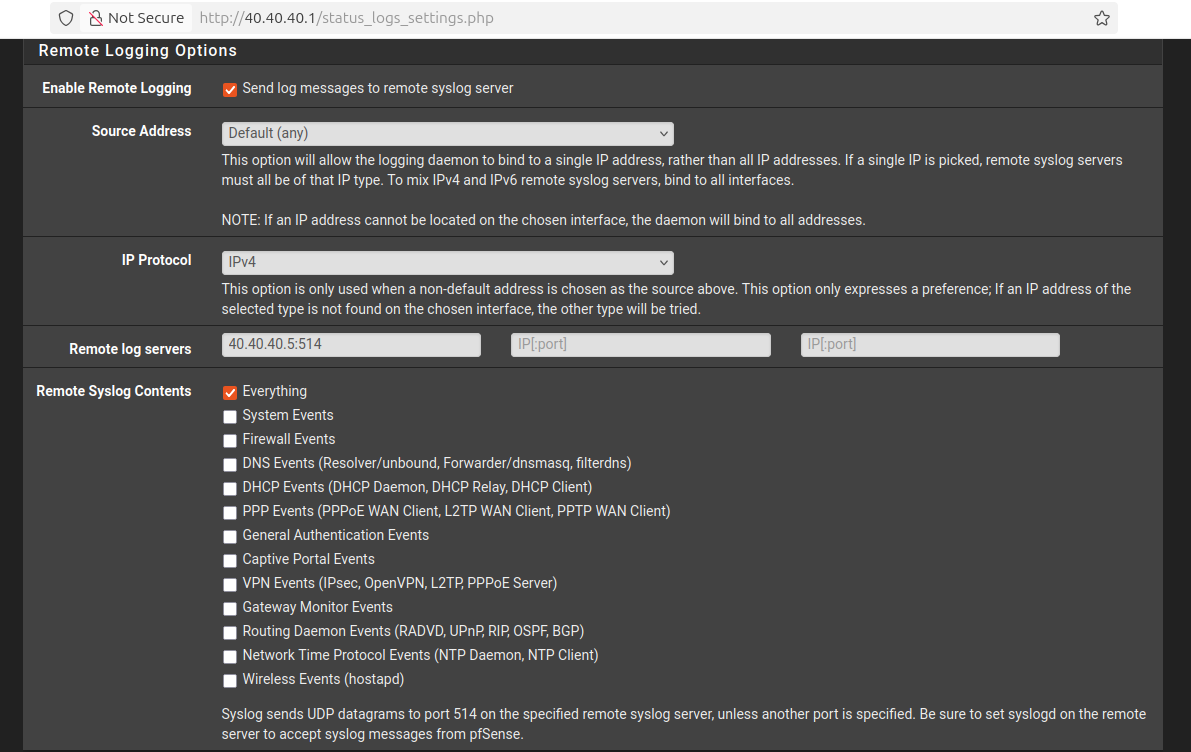
pfSense to Wazuh
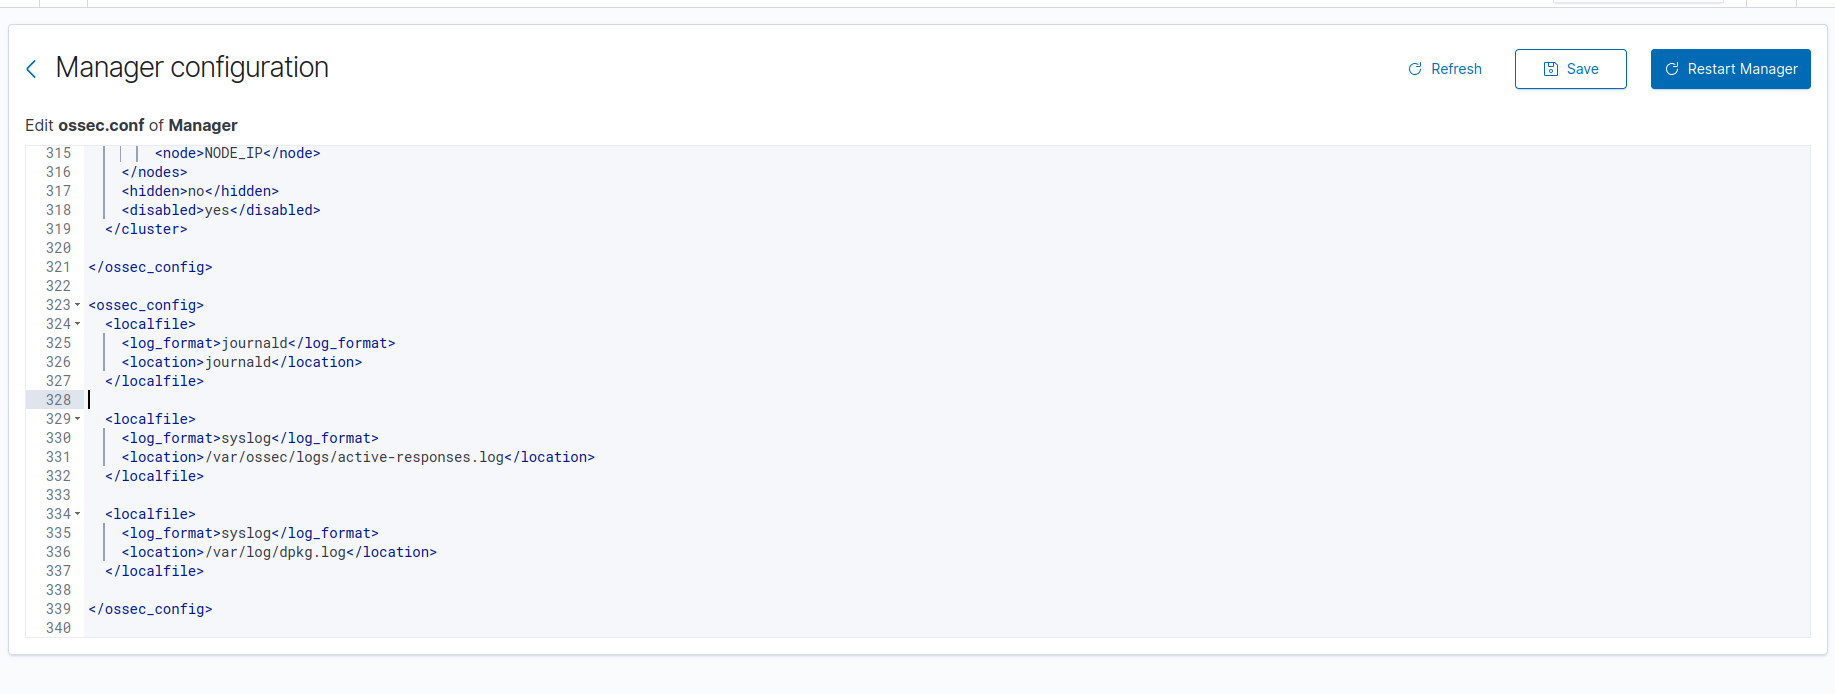
pfSense was configured to forward logs to the Wazuh server at 40.40.40.5:514, using IPv4 syslog output. I chose to forward everything at this stage because early lab validation is about signal completeness first and tuning later.
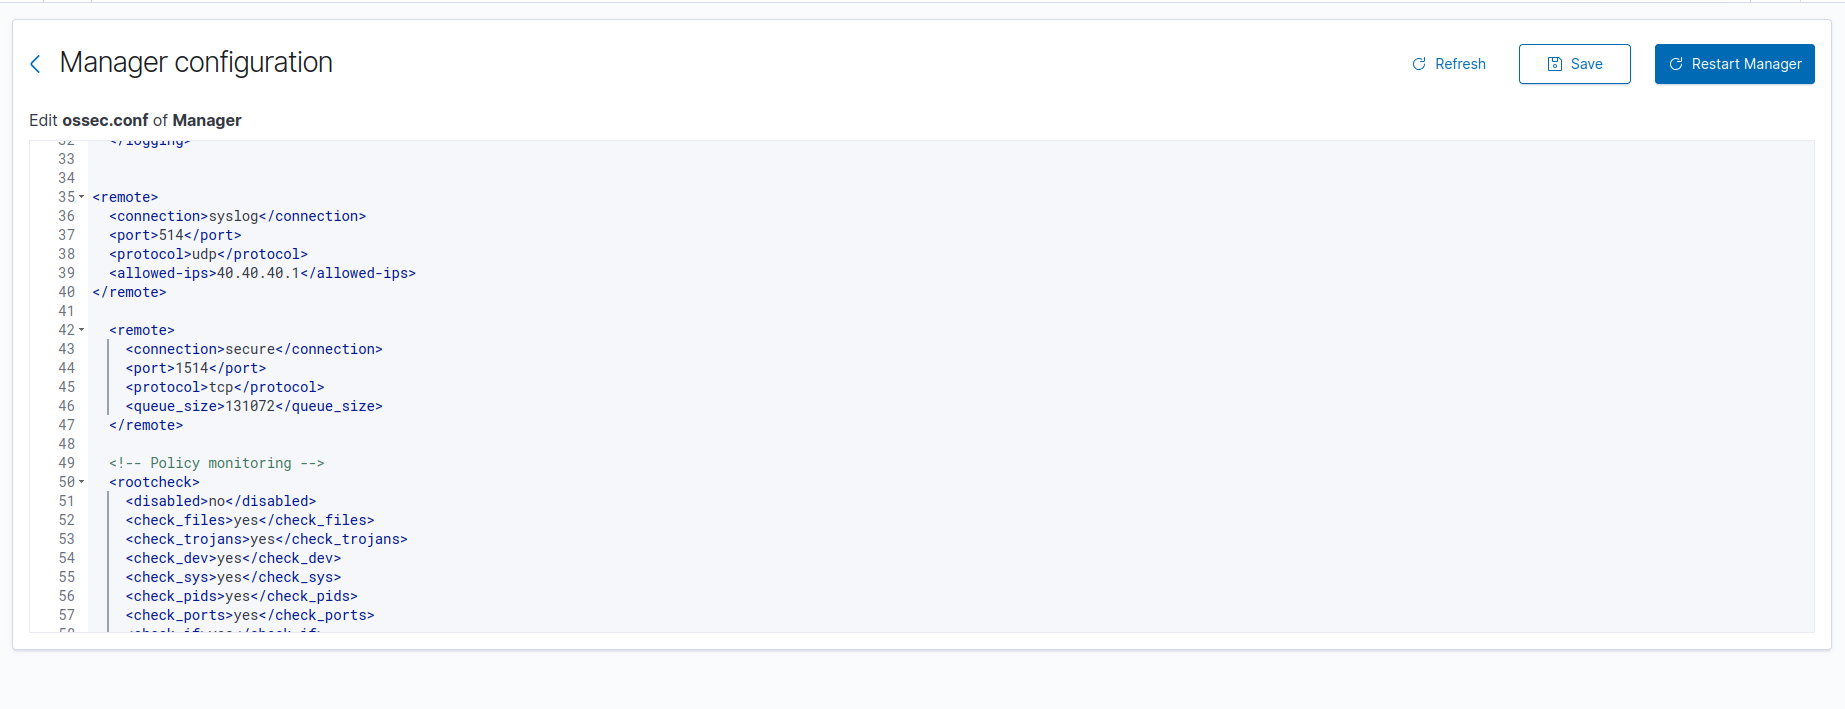
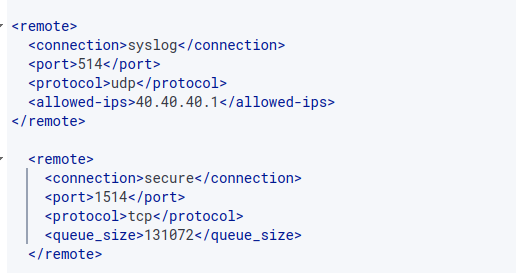
On the Wazuh manager, I enabled a dedicated syslog listener for pfSense:
1
2
3
4
5
6
<remote>
  <connection>syslog</connection>
  <port>514</port>
  <protocol>udp</protocol>
  <allowed-ips>40.40.40.1</allowed-ips>
</remote>
That allowed-ips value matters because it pins the syslog source to the pfSense SIEM-facing interface and avoids turning the manager into a generic UDP collector for the whole lab.
Transport alone is not the full acceptance criterion, though. For pfSense telemetry to become useful in later detection work, the next engineering check is parser readiness: representative pfSense messages need to be inspected in Wazuh to confirm that timestamps, source program names, interface information, actions, and source/destination fields are extracted in a way that rules can consume consistently.
The same logic applies to Snort. In this phase, I validated that Snort was attached at the gateway and that its alerts could enter the pfSense logging path. The stronger next-phase check is to confirm that a Snort event lands in Wazuh in a parseable form with fields such as signature, classification or priority, source IP, destination IP, and interface context. That parser-level verification belongs directly before custom decoders and correlation rules, not after them.
Agents to manager
The Windows and Linux endpoints used the secure Wazuh agent channel instead:
1
2
3
4
5
6
7
8
9
10
11
12
<remote>
  <connection>secure</connection>
  <port>1514</port>
  <protocol>tcp</protocol>
  <queue_size>131072</queue_size>
</remote>

<auth>
  <disabled>no</disabled>
  <port>1515</port>
  <use_password>no</use_password>
</auth>
This kept enrollment and transport clean:
1515handled agent registration1514/tcpcarried the secure event stream once agents were enrolled
End-to-end verification
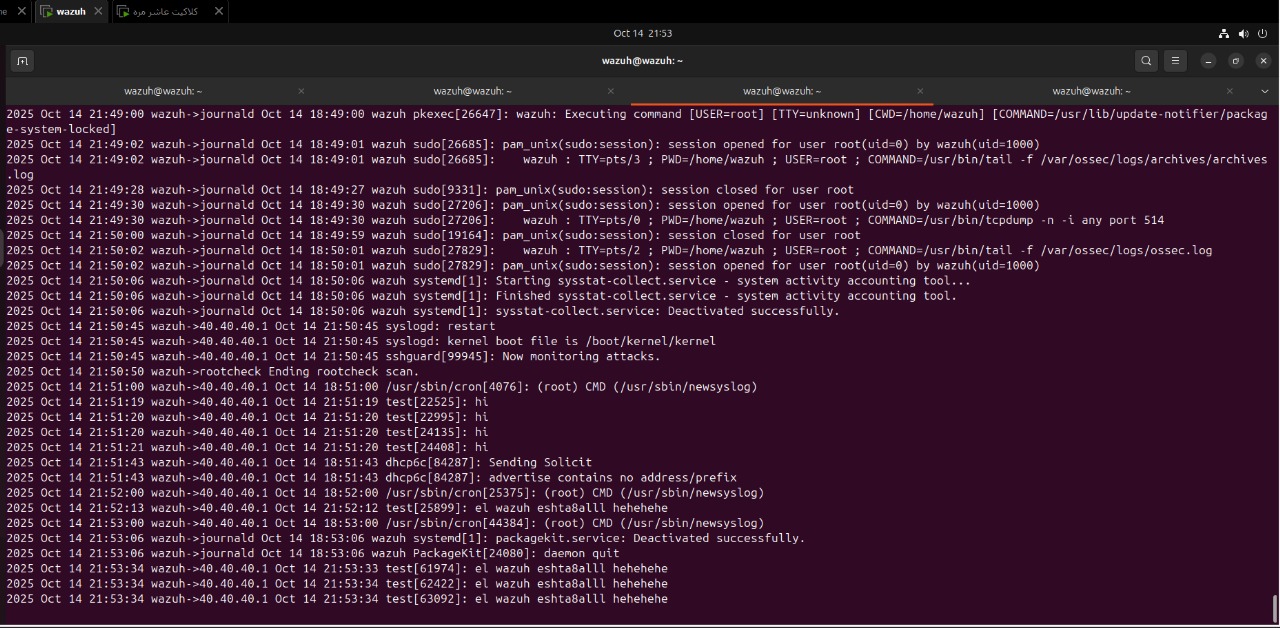
The most useful integration check was not just reading a dashboard tile. I manually generated a log entry on pfSense and watched it arrive on the Wazuh side. That confirmed the complete path:
- event created on the firewall
- syslog forwarded to the SIEM interface
- Wazuh listener received it
- the event became searchable and usable
That kind of validation is far more useful than assuming the path works because configuration screens look correct.
For Snort specifically, the operational claim in this post is limited to gateway-side deployment and transport-path readiness. The environment was exercised with attack traffic from Kali, but a preserved field-level Snort-in-Wazuh validation artifact is intentionally left for the decoder and rule-focused stages, where parser correctness matters more than deployment state alone.
Problems and Challenges
This lab did not work perfectly on the first pass, and that was part of the point.
1. pfSense package issues
Some pfSense package behavior was inconsistent enough to become a distraction during setup. The practical fix here was simple: stay on the latest stable package path instead of trying to force older combinations to behave.
2. Log collection from pfSense
At one point, log ingestion from pfSense was not reliable enough. The fix path was to adjust the forwarded log format and, when necessary, consider syslog-ng as the more robust collector side for normalization and ingestion stability.
This was a useful reminder that “logs are enabled” is not the same as “logs are arriving in a form the SIEM can reliably consume.”
3. Duplicate firewall logs
Firewall-side duplication also showed up. Technically, there are multiple ways to reduce that:
- reset the logging state and reinitialize the path
- filter at ingestion time
- normalize and deduplicate downstream
In this lab, I deliberately did not over-filter early. Over-aggressive filtering can remove high-value traces, especially around brute-force activity and repeated connection attempts. In a SOC pipeline, losing context is often worse than temporarily accepting noise.
4. Wazuh API startup failure
One of the more interesting problems came from the Wazuh side, where the dashboard reported an API availability problem even though the obvious logs were not immediately pointing to the root cause.
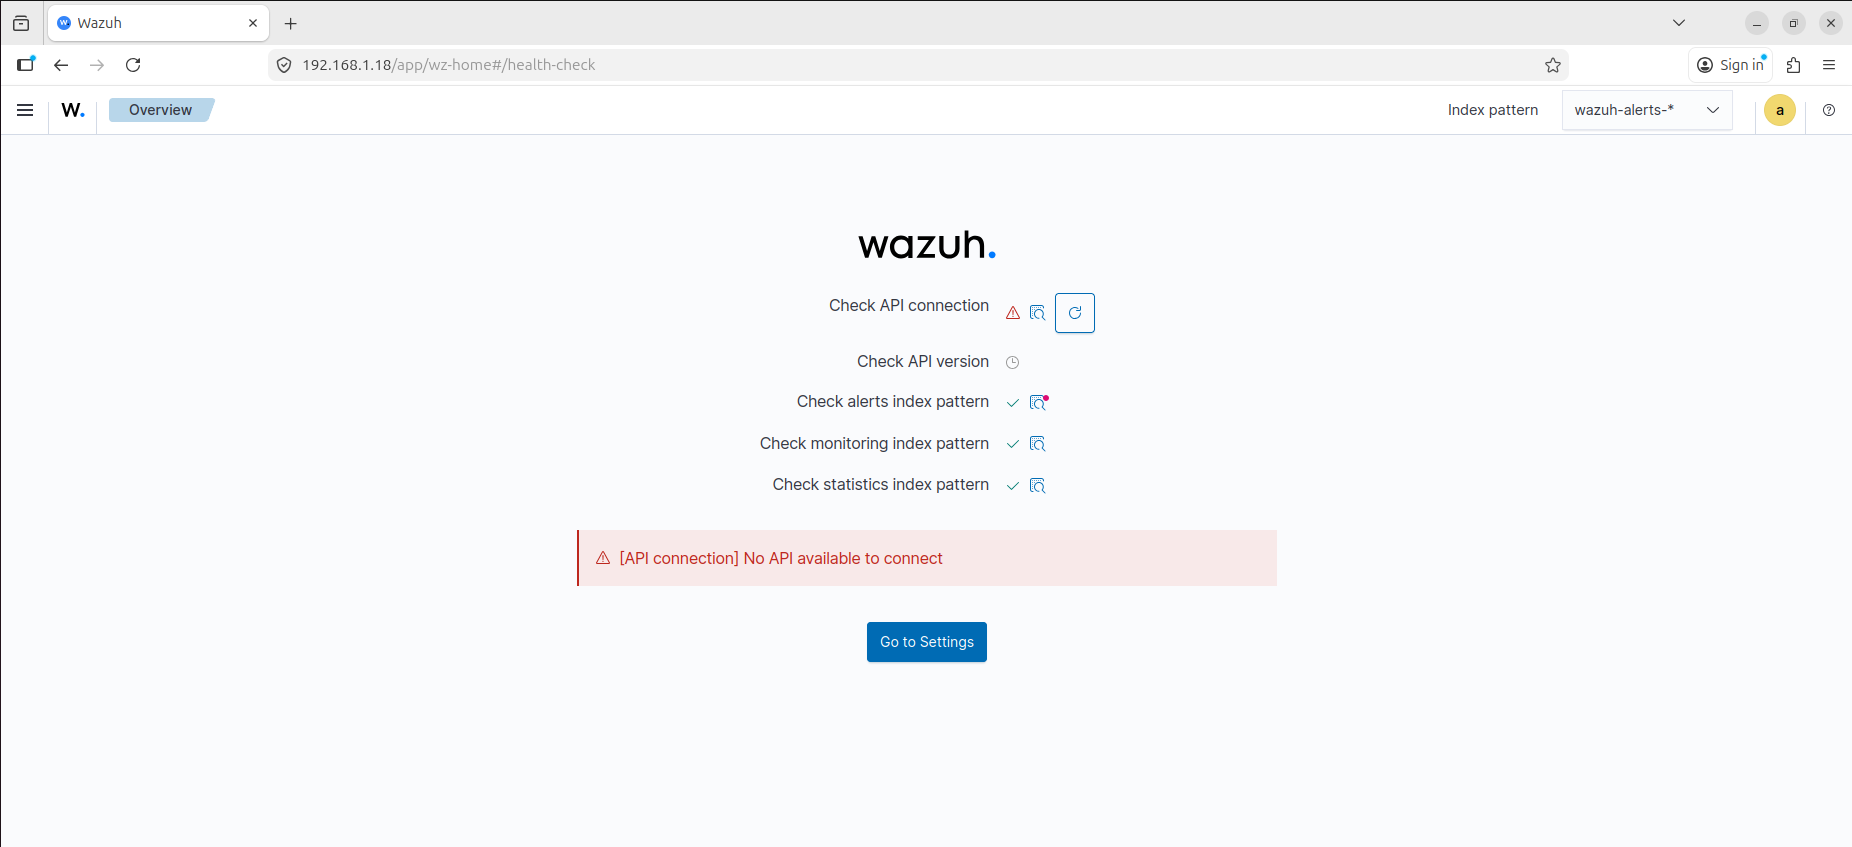
The issue turned out to be timing. The manager was checking service dependencies before the indexer was fully ready, which caused API health failures during startup.
That failure surfaced at the dashboard health-check layer first, which made it look like an API problem, but the real issue was the startup sequence underneath it.
The clean fix was to extend the manager startup timeout with a systemd override:
1
systemctl edit wazuh-manager
Then add:
1
2
[Service]
TimeoutSec=120
That gave the dependent services enough time to come up in the right order and stabilized the API check path.
To validate that this is the actual failure mode and not a generic API issue, the checks that matter are:
1
2
3
4
systemctl status wazuh-manager
systemctl status wazuh-indexer
journalctl -u wazuh-manager -b
journalctl -u wazuh-indexer -b
What I would expect to see in that condition is a manager-side startup delay while the indexer is still becoming healthy, followed by the dashboard surfacing the API failure before the backend services have converged fully. In other words, the fix is not just “raise the timeout”; the fix is “confirm backend startup order, then raise the timeout if the dependency chain is correct but too slow for the default service window.”
This was a good example of why troubleshooting in a SOC stack often requires thinking about service dependency timing, not just application logs.
Validation: Proving the Environment Worked
A lab is only useful if the telemetry path can be proven.
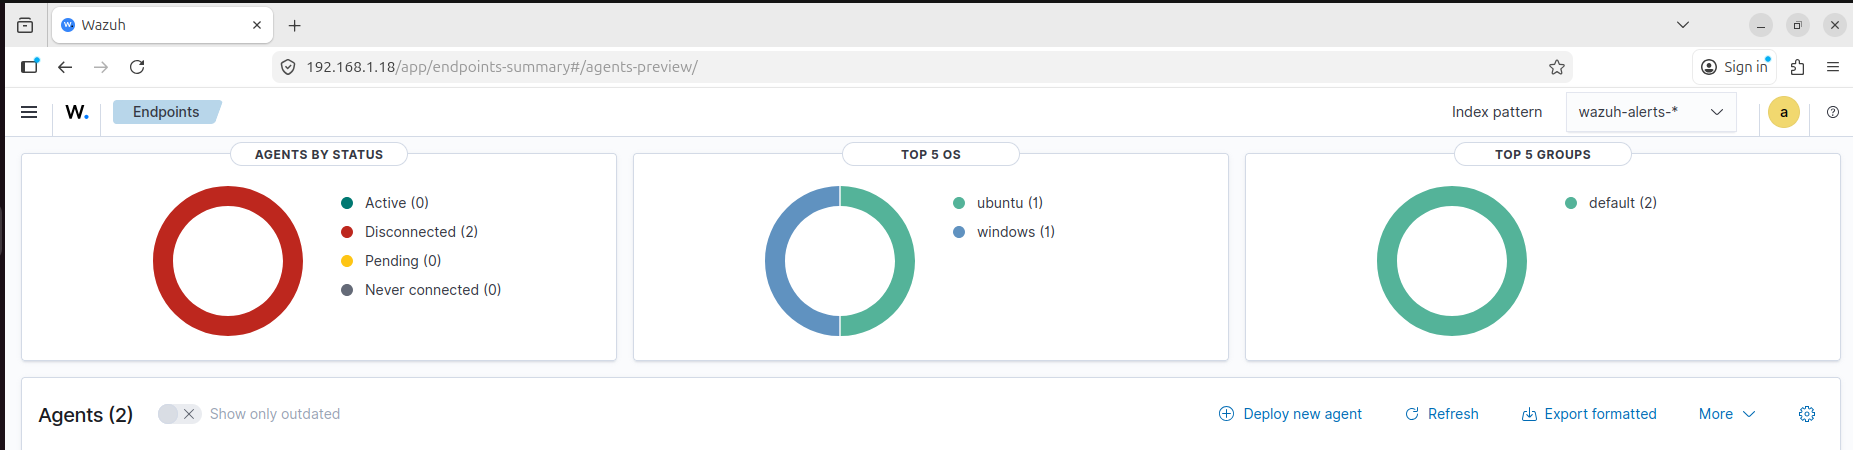
By the end of the setup, I had three important confirmation points:
- Both monitored endpoints were enrolled and active in Wazuh
- pfSense was forwarding logs to the manager successfully
- The SIEM was receiving enough data to support later detection and triage work
The validation process itself was broader than opening the dashboard once. I used a combination of infrastructure checks and event-generation checks:
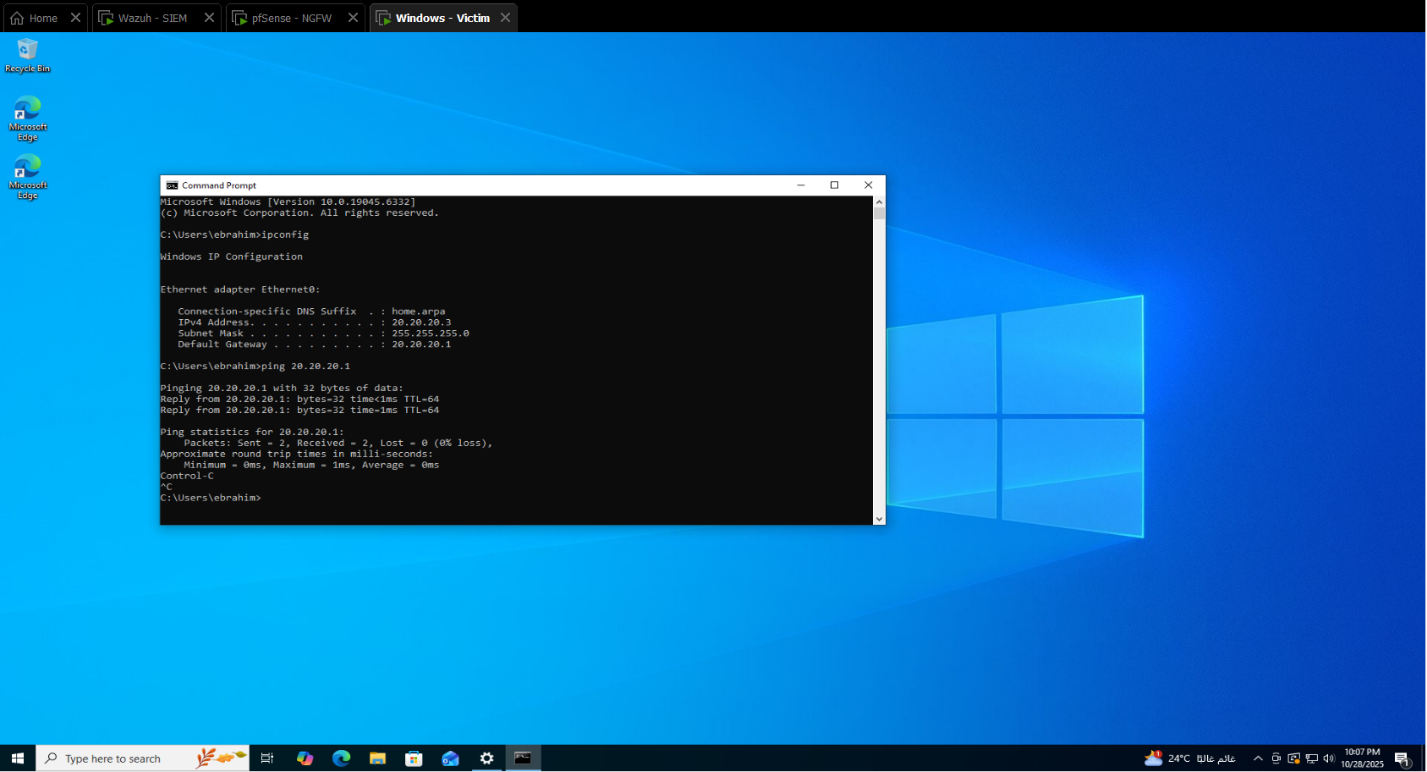
- verify DHCP leases and expected addresses from pfSense
- verify reachability between the planned segments
- generate pfSense login or rule events and confirm they arrived in Wazuh
- run
nmapfrom Kali toward the DVWA host and confirm that Snort activity was visible - trigger simple host-side events, such as failed logons or file-related activity, and confirm that the agents stayed responsive
The active agent view confirmed that both endpoints were live:
That mattered because the environment now had host coverage from both sides of the victim segment:
dvwaon LinuxDESKTOP-35FAQ07on Windows
At the same time, forwarded firewall telemetry was arriving on the manager, including manually generated test entries used to confirm the syslog path.
What this validation proves strongly:
- endpoint enrollment and secure transport are working
- pfSense syslog forwarding is working
- the SIEM plane is receiving enough host and gateway data to move into parsing and rule work
What this validation does not yet claim:
- final parser quality for pfSense events
- field-level Snort alert extraction inside Wazuh
- Apache web log onboarding from the DVWA host
Together, those checks gave me confidence that the environment was no longer just deployed. It was operational.
Each of the three original success criteria closed cleanly:
- endpoint enrollment succeeded on both Windows and Linux
- pfSense telemetry reached Wazuh over the expected syslog path
- the combined host and gateway data was visible enough to support the next phase of parser and rule work
That matters because “services are running” is not the same as “the SOC environment is usable.” The environment only became operational once those three statements were true at the same time.
Known Limitations in This Phase
The environment is intentionally useful before it is elegant. At the end of phase 1, the known technical debt looked like this:
- Wazuh is still deployed as an all-in-one node
- victim-side rules remain permissive enough to favor integration speed over least privilege
- pfSense syslog uses
UDP/514, which is simple and effective for the lab but not the strongest transport posture - no alias abstraction has been introduced yet in the firewall policy
- duplicate firewall events are not fully normalized or deduplicated downstream
- advanced endpoint source onboarding is deferred until after baseline enrollment and transport are stable
- field-level parser validation for pfSense and Snort is still pending the decoder/rule-focused phase
I consider that acceptable debt for this stage because the environment is now reliable enough to support the next posts, where parsing, decoders, rules, and correlation matter more than raw installation progress.
Closing Thoughts
This first stage was not about building the prettiest lab. It was about building a SOC environment with clear boundaries, predictable traffic paths, endpoint enrollment, network telemetry, and enough operational realism to support actual detection work.
At this point, the important question is no longer how to install Wazuh.
The real question is what Wazuh is doing internally when agents, syslog sources, and detection logic all start feeding the same pipeline.
That is where the next part of the series begins.