Wazuh Engineering Series | Part 1: Architecture & Deployment
Deep dive into Wazuh SIEM architecture - from All-in-One to Production Cluster. Based on real Mini SOC experience.
1. Introduction
If you’ve ever tried building a SOC using commercial tools like Splunk or Microsoft Sentinel, you know the drill: thousands of dollars in licensing fees before you even see your first alert. The sales calls, the complex procurement, the “contact us for pricing” pages.
But what if you’re a small company that needs real visibility without the enterprise budget?
That’s where Wazuh comes in.
History Of Wazuh
Wazuh began in 2015 as a fork of the open-source Host-based Intrusion Detection System (HIDS) OSSEC. Founded by Santiago Bassett, the project started with a simple mission: take the solid detection foundation of OSSEC and expand it into something far more capable.
What started as an enhanced HIDS quickly evolved. By integrating the ELK stack (now migrated to OpenSearch), Wazuh transformed from a log analysis tool into a comprehensive open-source XDR and SIEM platform. The journey included major milestones like native cloud support (2019-2020) and a relentless focus on enterprise scalability—without the enterprise price tag.
Today, Wazuh sits in a unique position. It’s not just a free alternative to Splunk or Sentinel; it’s a legitimate production-grade platform used by Fortune 500 companies, MSSPs, and security researchers worldwide. It combines Host Intrusion Detection, File Integrity Monitoring, Vulnerability Detection, Configuration Assessment, Active Response AND a SIEM And more into a single architecture that can monitor everything from a single laptop to a 50,000-node datacenter.
What You’ll Learn in This Post
- Wazuh Architecture from A to Z: Agents → Manager → Indexer → Dashboard
- Deployment Models: All-in-One vs Distributed vs Cluster (with real numbers from the docs)
- EPS (Events Per Second) limits and when you need to start scaling
- Real-world guidance: From my Mini SOC project to production enterprise setups
From the Trenches: Mini SOC Project
Note: Throughout this series, I’ll reference real-world examples from my Mini SOC architecture a fully segmented lab environment with pfSense, Wazuh, Windows endpoints, and DVWA. If you want to see these concepts in action within a complete network architecture, check that build first.
2. What is Wazuh?
Wazuh is often described as a SIEM, but in reality it is a unified security monitoring platform that combines multiple security capabilities in one ecosystem.
It can cover several important security functions, but it’s important to understand that it does this through integrated modules and rule-based detection, not as a full replacement for specialized enterprise tools.
The Main Security Capabilities in Wazuh
1. Host-Based Intrusion Detection (HIDS)
Wazuh monitors system activity through agents installed on endpoints.
- Tracks processes, users, and system logs
- Detects suspicious behavior like privilege escalation or known attack patterns
- Works through OS-level telemetry (e.g., audit logs, ETW on Windows, and optional eBPF support on Linux)
NOTE: While it provides strong visibility and detection capabilities, it is not a full replacement for advanced commercial EDR solutions, as it lacks built-in machine learning and deep behavioral analytics engines.
2. File Integrity Monitoring (FIM)
One of Wazuh’s strongest features.
- Monitors changes to critical system and application files
- Uses checksum validation to detect modifications
- Can watch sensitive paths like system configs or registry keys
3. Security Configuration Assessment (SCA)
Continuously checks system compliance against security benchmarks.
- Supports CIS benchmarks, PCI-DSS, NIST guidelines
- Validates configuration states, not just presence of settings
- Helps enforce baseline security posture across systems
4. Vulnerability Detection
Wazuh can identify known vulnerabilities by mapping installed packages against CVE databases.
- Uses continuously updated vulnerability feeds
- Provides visibility into outdated or vulnerable software
- Works agent-side without active network scanning
This is best seen as continuous vulnerability awareness, not a replacement for full-featured scanners like Nessus or Qualys, but it remains a strong capability within Wazuh.
5. Active Response (Automation)
Wazuh can trigger automated responses when specific rules are matched.
- Block IP addresses
- Kill malicious processes
- Disable accounts
- Run custom scripts for remediation
This enables basic XDR-like automation, but it is rule-driven and depends heavily on configuration.
6. SIEM & Log Analytics
Centralized log collection and analysis powered by OpenSearch.
- Aggregates logs from endpoints, servers, and network devices
- Supports correlation rules and alerting
- Provides fast search and dashboards for investigation
- Offers efficient storage through compression mechanisms (varies by workload and setup)
Why Organizations Use Wazuh
Cost Efficiency
- Open-source with no per-GB or per-agent licensing
- You mainly pay for infrastructure resources
Agent-Based Visibility
- Provides deeper endpoint visibility compared to syslog-only solutions
- Collects logs and system telemetry from installed agents
Lightweight Deployment
- Designed to run with relatively low resource usage per agent
- Suitable for large-scale deployments when properly tuned
Unified Platform Approach
- Combines multiple security functions in a single system
- Reduces the need to integrate separate tools manually
The Bottom Line
Wazuh is a powerful and flexible security platform that brings together:
- Log management (SIEM)
- File integrity monitoring
- Vulnerability visibility
- Compliance checks
- automated response
However, it should be understood as a unified open-source security ecosystem, not a full drop-in replacement for specialized enterprise-grade EDR, SIEM, and vulnerability management stacks.
It works best as a central layer of security visibility and detection, especially in cost-sensitive or open-source–oriented environments.
3. Wazuh Architecture Overview & Data Flow
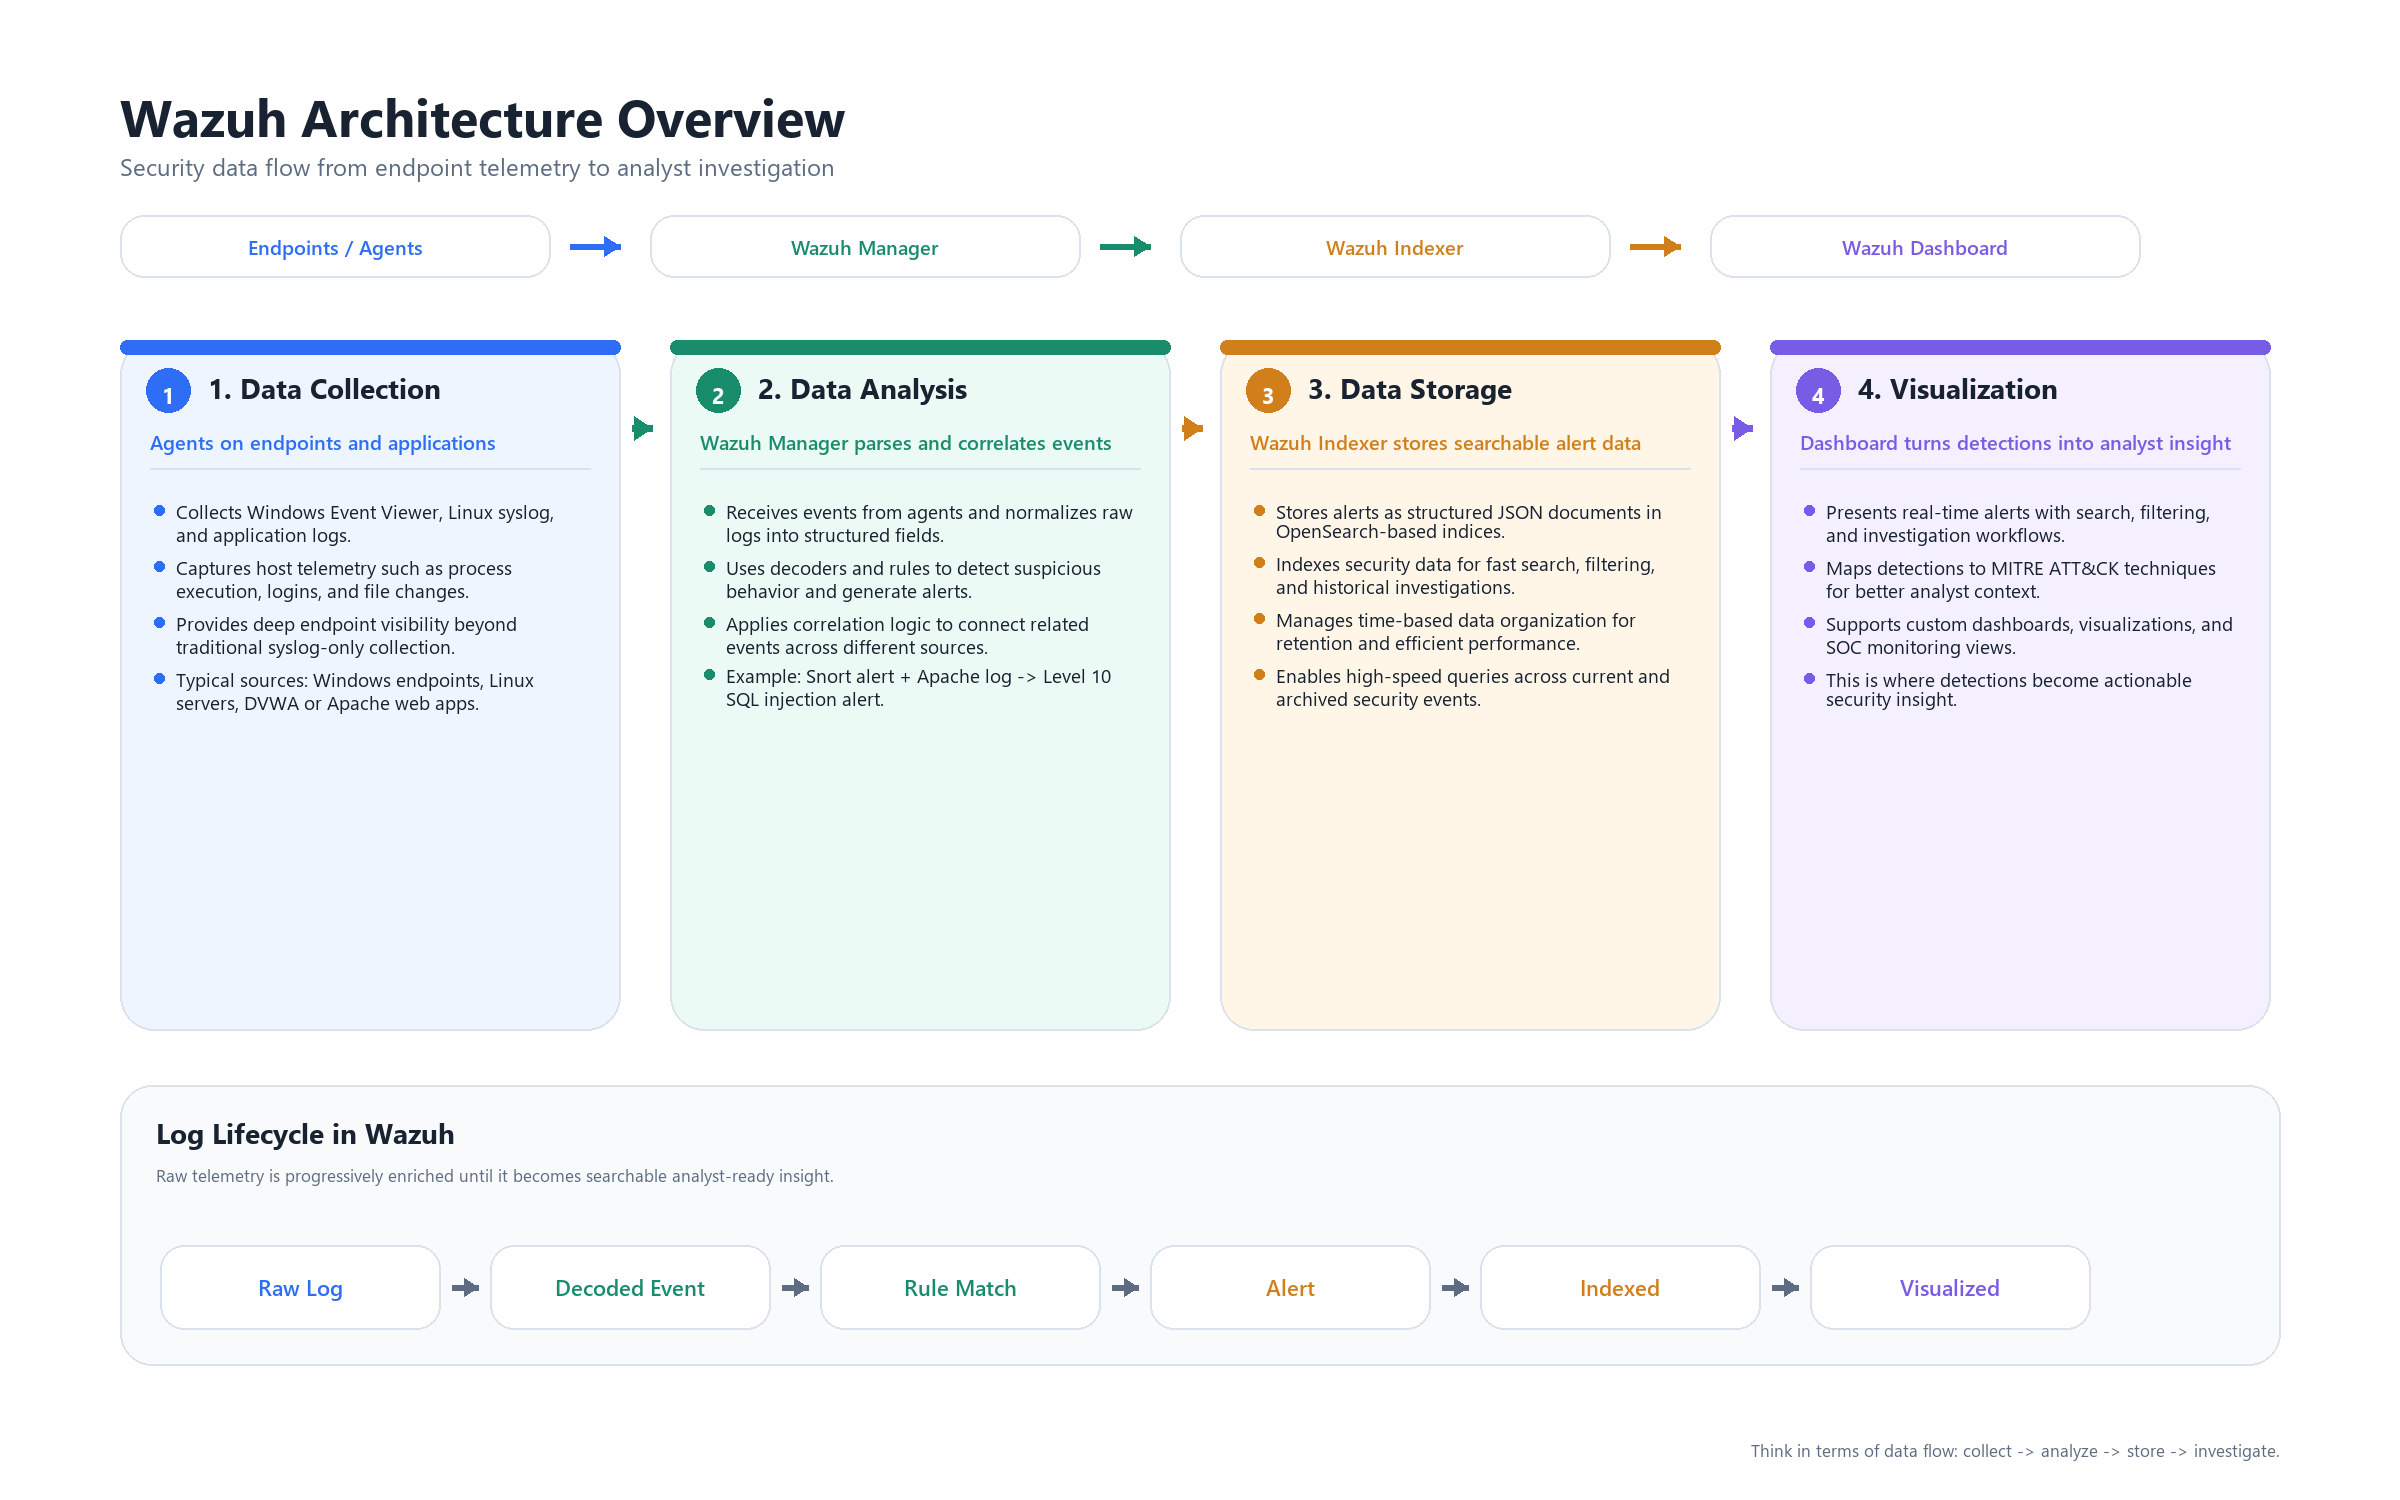
To understand Wazuh properly, you should not think of it as a single tool, but as a multi-stage security data processing pipeline.
This pipeline transforms raw system activity into structured, searchable, and actionable security events.
At a high level, Wazuh consists of four logical layers:
[Agent] → [Manager] → [Indexer] → [Dashboard]
Each layer has a clearly defined role in processing and enriching data as it moves through the system.
Stage 1: Data Collection (Wazuh Agent)
The process begins at the endpoint level.
The Wazuh Agent is responsible for collecting telemetry from the host system. It operates locally and continuously monitors system activity.
It collects data from multiple sources, including:
- System logs (Windows Event Logs, syslog)
- Application logs (e.g., web servers, databases)
- File Integrity Monitoring (FIM)
- Process and system activity
- Configuration and asset inventory (via Syscollector)
At this stage, data is:
- Raw
- Unstructured
- Context-free
The agent does not perform detection or correlation.
Its role is strictly data collection and forwarding.
Stage 2: Analysis (Wazuh Manager)
The Wazuh Manager is the central analysis and detection engine.
All incoming data from agents is processed through a structured pipeline that converts raw logs into security-relevant events.
Step 1: Decoding
Incoming logs are parsed using decoders.
Decoders extract structured fields from raw log messages, such as:
- source IP
- destination IP
- username
- event type
- request details
This transforms unstructured text into parsed data that can be analyzed.
Step 2: Rule Matching
Decoded events are evaluated against a predefined ruleset.
Rules define detection logic such as:
- authentication failures
- suspicious commands
- known attack patterns
- policy violations
When a rule matches:
- The event is classified
- A severity level is assigned
- Contextual metadata is added
Step 3: Correlation
Wazuh supports correlation across multiple events.
Instead of analyzing events in isolation, the manager can:
- Link related events across time
- Combine signals from different sources
- Identify behavioral patterns
This enables higher-confidence detections compared to single-event alerts.
Step 4: Alert Generation
When detection conditions are met, an alert is generated.
At this point:
- The event is fully structured
- It contains contextual information
- It is assigned a severity level
It is important to distinguish between:
- Alerts → events that triggered rules
- Archives → full raw telemetry (optional but useful for investigations)
Only alerts are typically forwarded for indexing by default.
Stage 3: Storage and Indexing (Wazuh Indexer)
After analysis, alerts are forwarded to the Indexer.
The Indexer is responsible for:
- Storing data as structured documents
- Organizing data into time-based indices
- Enabling fast and efficient querying
Each alert is stored with fields such as:
- timestamp
- rule ID and description
- severity level
- agent and host information
- extracted event data
This layer enables:
- Full-text search
- Filtering and aggregation
- Historical analysis
Without indexing, large-scale log analysis would not be feasible.
Stage 4: Visualization and Investigation (Dashboard)
The Dashboard is the analyst interface layer.
It does not process or generate data.
Instead, it retrieves data from the Indexer and presents it in a structured and interactive format.
Through the dashboard, analysts can:
- Monitor alerts in real time
- Search and filter events
- Investigate incidents
- Build visualizations and dashboards
- Map detections to frameworks such as MITRE ATT&CK
This is where processed data becomes actionable insight.
End-to-End Data Flow Summary
The lifecycle of an event in Wazuh can be summarized as follows:
Raw Event (Endpoint)
→ Collected by Agent
→ Decoded and analyzed by Manager
→ Evaluated against rules and correlation logic
→ Converted into an Alert
→ Indexed for storage and search
→ Queried and visualized in Dashboard
Key Concept
Wazuh is not just a log collection system.
It is a data transformation pipeline that:
- collects raw telemetry
- structures it
- applies detection logic
- and exposes it for investigation
Understanding this pipeline is essential before moving into:
- rule engineering
- correlation design
- scaling and architecture decisions
4. Core Components Deep Dive
Now that the data flow is clear, we can examine each core component in detail.
Each component in Wazuh is designed with a single responsibility, and together they form a complete security monitoring pipeline.
4.1 Wazuh Agent
The Wazuh Agent is responsible for collecting telemetry from endpoints.
It runs locally on the system and gathers data from multiple sources, including:
- System logs (Windows Event Viewer,
/var/log/) - Application logs (e.g., Apache, Nginx, databases)
- Sysmon integration (process creation, network connections on Windows)
- File Integrity Monitoring (e.g.,
/etc/passwd, registry, web configs) - Security Configuration Assessment (CIS benchmarks and policy checks)
- System inventory (packages, ports, running processes)
Internal Modules
The agent is modular, with key components such as:
- Logcollector → collects logs from files and system sources
- Syscheck → monitors file integrity (FIM)
- Syscollector → gathers system inventory
- Rootcheck → detects rootkits and anomalies
Platform Support
Wazuh agents support a wide range of operating systems:
- Windows (Windows 7 → Windows 11, Server 2012 → 2022)
- Linux (all major distributions)
- macOS
- Unix systems (Solaris, AIX, HP-UX)
Performance Characteristics
The agent is designed to be lightweight:
- CPU usage: typically < 1%
- Memory usage: ~35–50 MB
- Network usage: configurable (compression supported)
Key Design Principle
The agent does not perform detection logic.
It focuses only on data collection and forwarding, keeping analysis centralized at the manager.
4.2 Wazuh Manager
The Wazuh Manager is the core analysis and detection engine.
It receives all incoming data from agents and processes it through decoding, rule matching, and correlation.
Core Daemons
The manager is composed of multiple internal services:
| Daemon | Function |
|---|---|
| remoted | Receives data from agents |
| analysisd | Performs decoding, rule matching, and correlation |
| authd | Handles agent enrollment |
| apid | Provides REST API for automation and integration |
Detection Capabilities
The manager provides the main detection logic through:
- Rules Engine → ~3000 built-in rules out-of-the-box
- Decoders → parse logs from 100+ sources and formats
- Correlation → link events across time and multiple agents
- Active Response → execute automated actions (block IP, disable user, kill process, custom scripts)
Processing Characteristics
The most critical component is analysisd.
It is responsible for:
- parsing incoming data
- applying detection logic
- generating alerts
This component is CPU-intensive and typically becomes the first bottleneck in high-volume environments.
4.3 Wazuh Indexer
The Wazuh Indexer is responsible for storing and organizing processed data.
It is built on OpenSearch and functions as a distributed search and analytics engine.
Data Model
All alerts are stored as structured JSON documents.
Each alert becomes a document inside an index, for example:
wazuh-alerts-YYYY.MM.DD(time-based indices)
Core Concepts
- Indices → logical data separation over time
- Shards → distribute data across nodes for scalability
- Replicas → duplicate data for high availability
Capabilities
The Indexer enables:
- fast search and filtering
- aggregation and analytics
- historical investigations
It uses a query language similar to SQL (Lucene-based syntax) for log exploration.
Performance Considerations
Performance depends on:
- disk I/O throughput
- memory (heap size)
- indexing rate
This layer becomes critical when dealing with large volumes of data.
4.4 Wazuh Dashboard
The Wazuh Dashboard is the analyst-facing interface.
It does not process or generate data.
Instead, it queries the Indexer and Manager API to present information in a usable format.
Core Modules
The dashboard provides multiple built-in views:
- Security Events → main alert view
- Integrity Monitoring → FIM events
- Vulnerabilities → detected CVEs
- MITRE ATT&CK → mapped techniques and tactics
- SCA → compliance and configuration assessment
Key Features
- Real-time alert monitoring
- Advanced search and filtering (Discover tab)
- Custom dashboards and visualizations
- Ad-hoc querying
- Reporting (PDF / CSV export)
Role in the Architecture
The dashboard is strictly a visualization layer.
All processing is already done by:
- the Manager (analysis)
- the Indexer (storage)
The dashboard simply exposes this data for investigation and decision-making.
Component Interaction Summary
Each component in Wazuh has a clearly defined role:
- Agent → collects and forwards data
- Manager → analyzes, detects, and correlates
- Indexer → stores and indexes structured data
- Dashboard → visualizes and presents data
This separation of responsibilities is what allows Wazuh to scale efficiently and operate in both small and large environments.
5. Deployment Models
Choosing the right deployment model in Wazuh is not just a technical decision—it directly impacts scalability, reliability, and operational stability.
Wazuh supports multiple deployment approaches, ranging from quick lab setups to full enterprise clusters.
5.1 All-in-One (Single Node)
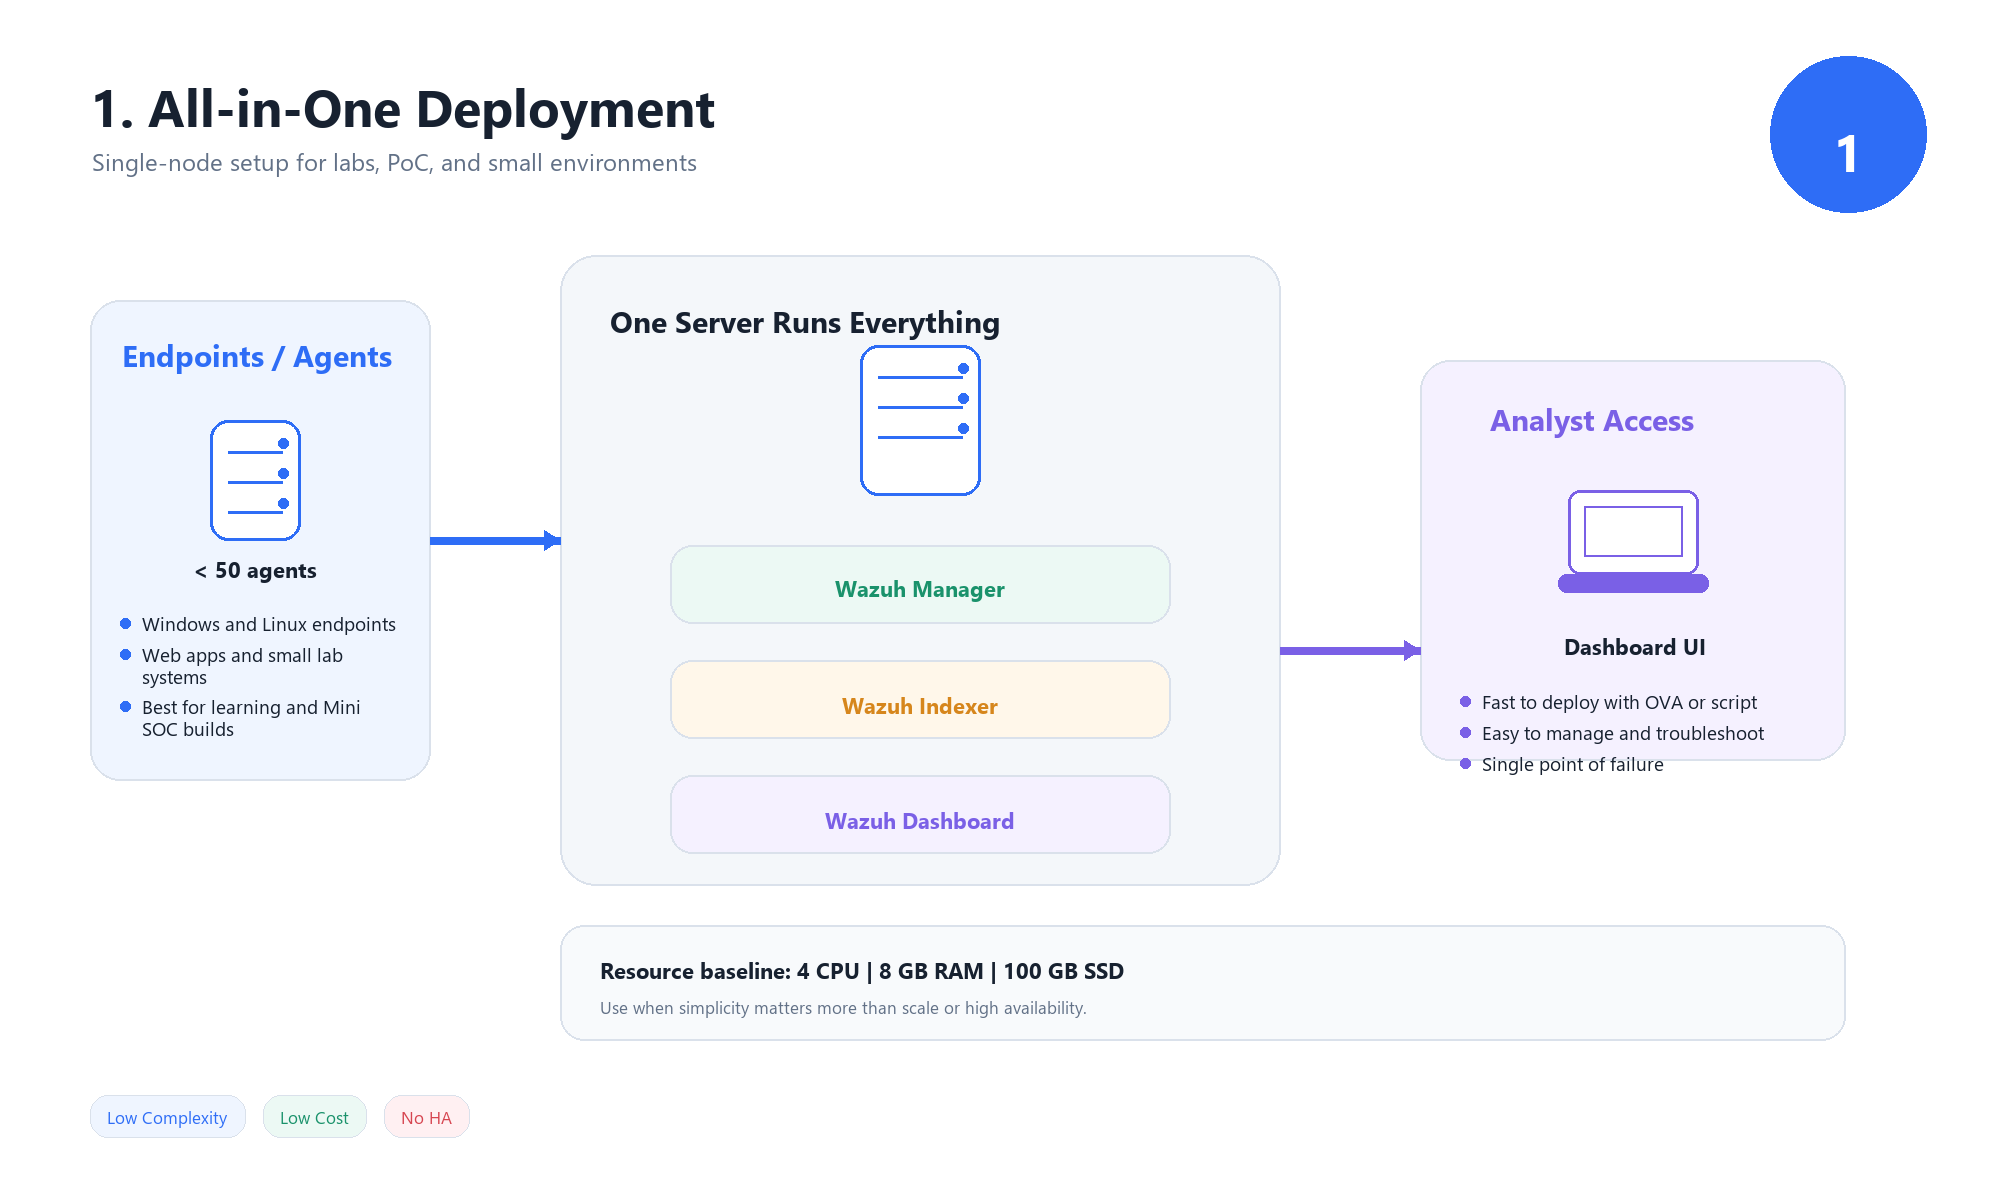 In this model, all Wazuh components run on a single machine:
- Wazuh Manager
- Wazuh Indexer
- Wazuh Dashboard
Resource Requirements
Typical baseline:
- CPU: 4 cores
- RAM: 8 GB
- Disk: 100 GB SSD
When to Use
This model is best suited for:
- Lab environments and learning
- Proof of Concept (PoC) deployments
- Small offices with limited endpoints (< 50 agents)
- Mini SOC setups
Wazuh OVA (Quick Deployment Option)
For this deployment model, Wazuh provides a prebuilt OVA image that includes all components preconfigured.
This allows you to:
- Deploy Wazuh in minutes using VMware or VirtualBox
- Avoid manual installation and configuration
- Quickly start testing and learning
This option is ideal for:
- beginners
- training environments
- rapid prototyping
However, it should be treated as a lab or demo environment, not a production-ready setup.
Advantages
- Simple installation (single script or OVA deployment)
- Minimal infrastructure requirements
- Easy to manage and troubleshoot
- Ideal for development and testing
Limitations
- Single point of failure
- Limited scalability (typically < 100 agents)
- Resource contention between components
- Failure in one component impacts the entire system
5.2 Distributed Deployment (Small–Medium Scale)
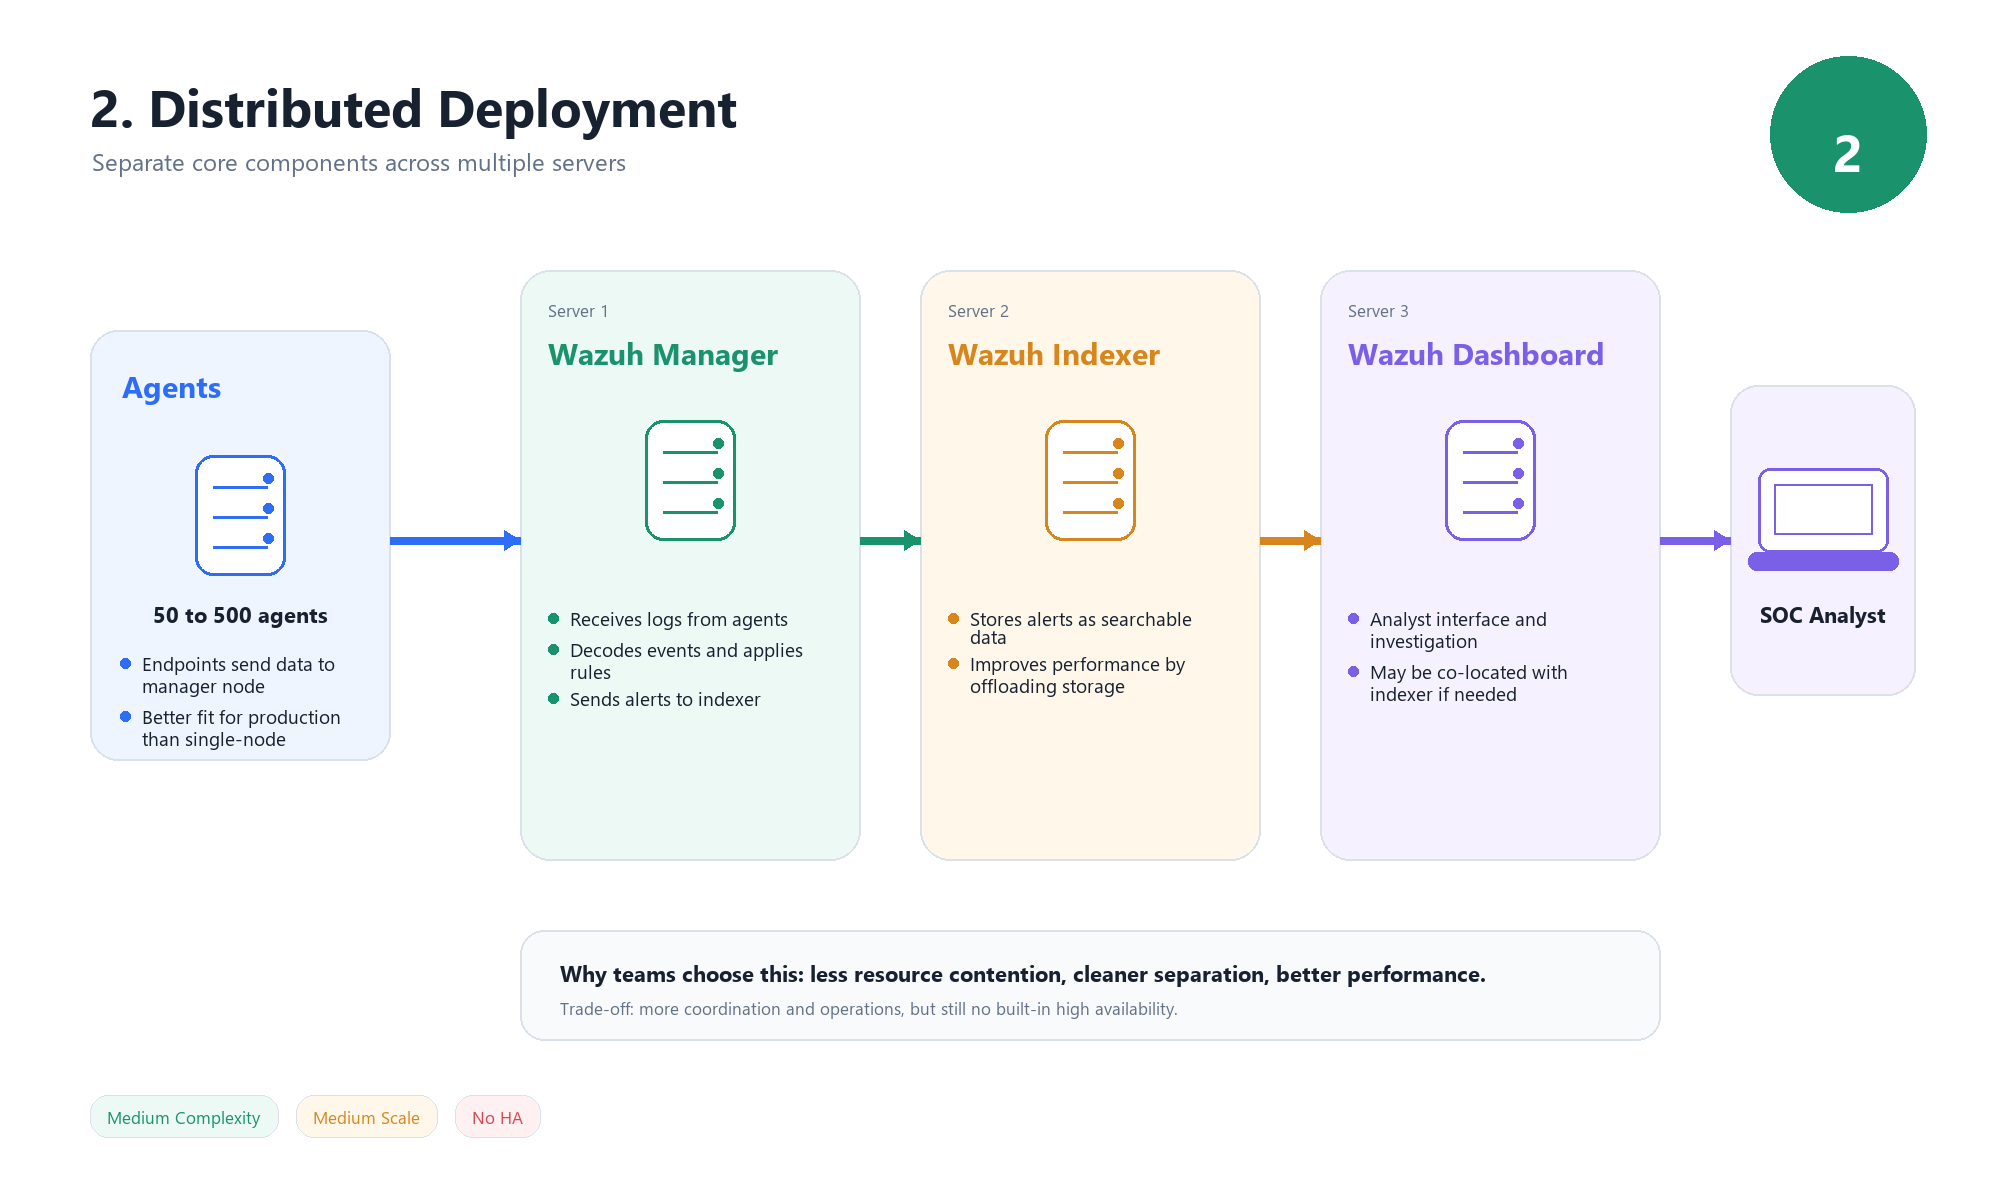 In this model, Wazuh components are separated across multiple servers.
Typical architecture:
- Server 1 → Wazuh Manager
- Server 2 → Wazuh Indexer
- Server 3 → Wazuh Dashboard (can be co-located with Indexer)
When to Use
This model is suitable for:
- 50–500 agents
- Small to medium production environments
- Scenarios where separation of responsibilities is required
Key Benefits
- Reduced resource contention
- Better performance compared to single-node deployments
- Ability to scale components independently
Limitations
- No built-in high availability
- Increased operational complexity
- Requires coordination between multiple nodes
5.3 Cluster Deployment (Enterprise / Production)
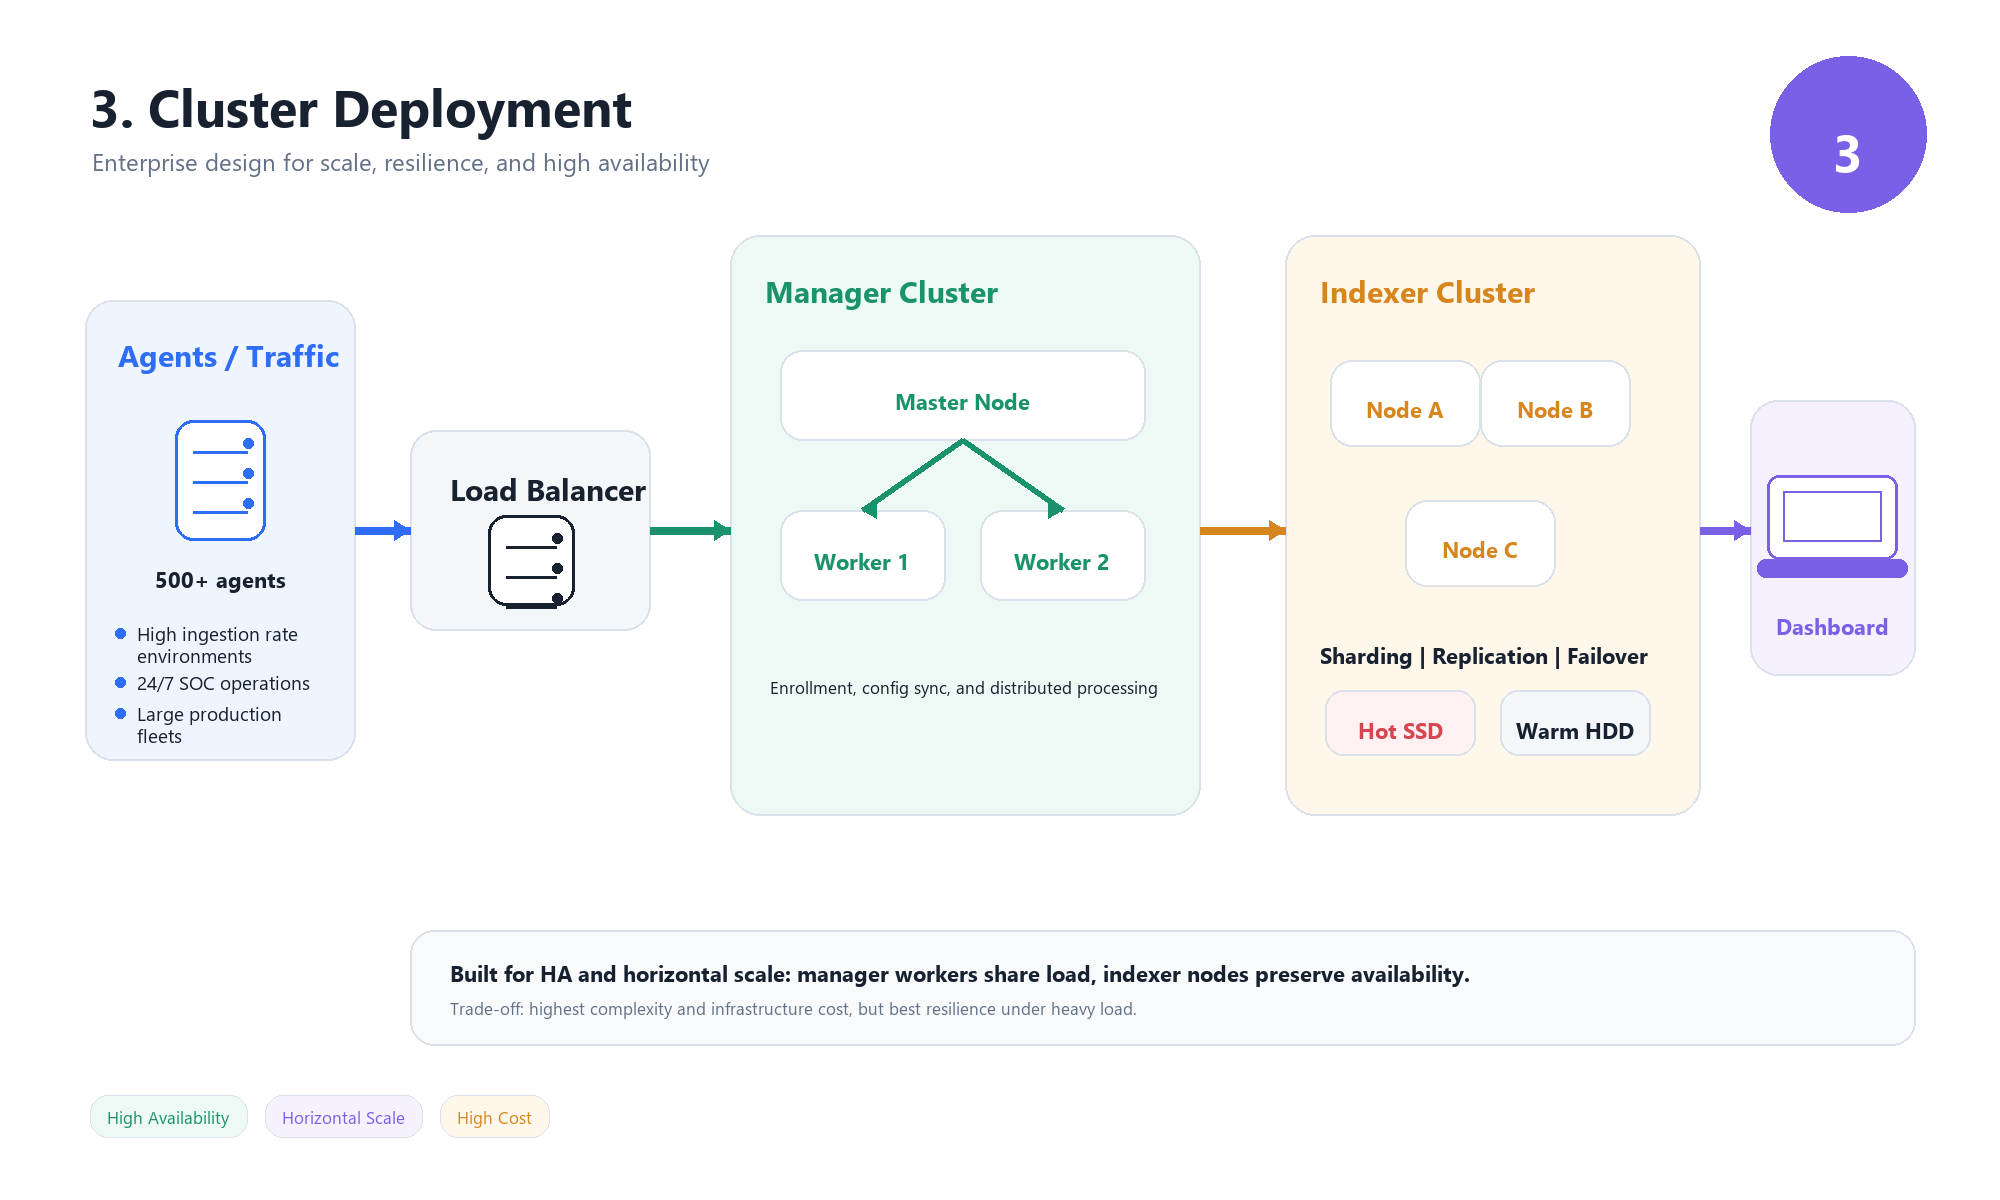 This is the full-scale production model designed for high availability and large environments.
Each component is deployed as a cluster.
Manager Cluster
- Master Node
- Handles configuration and agent enrollment
- Worker Nodes
- Receive and process data from agents
- Distribute workload
- Load Balancer
- Distributes connections across workers
Indexer Cluster
- Minimum of 3 nodes (for fault tolerance)
Supports:
- Sharding → distributes data
- Replication → ensures redundancy
- Failover → maintains availability
Hot–Warm Architecture
Used for efficient storage management:
- Hot Nodes (SSD) → recent data, high performance
- Warm Nodes (HDD) → older data, cost-efficient storage
When to Use
Recommended for:
- Large-scale environments (500+ agents)
- High event ingestion rates (> 1000 EPS)
- 24/7 production SOCs requiring high availability
Key Benefits
- High availability
- Horizontal scalability
- Resilience to failures
- Better performance under load
Trade-offs
- Complex deployment and management
- Requires load balancing and orchestration
- Higher infrastructure cost
5.4 Deployment Comparison
| Feature | All-in-One | Distributed | Cluster |
|---|---|---|---|
| Setup Complexity | Low | Medium | High |
| Number of Agents | < 100 | 100–500 | 500+ |
| High Availability | No | No | Yes |
| Scaling | Vertical only | Limited | Horizontal |
| Cost | Low | Medium | High |
| Use Case | Lab / Mini SOC | Small SOC | Enterprise SOC |
Key Decision Insight
The choice of deployment model should be driven by:
- number of agents
- event volume (EPS)
- availability requirements
- infrastructure constraints
A common progression is:
All-in-One → Distributed → Cluster
as the environment grows in scale and complexity.
5.5 Event Volume (EPS) and Scaling Considerations
One of the most important factors when designing a Wazuh deployment is the event rate, measured as Events Per Second (EPS).
EPS represents how many events your environment generates and sends to the Wazuh Manager every second.
Why EPS Matters
As EPS increases:
- CPU usage on the Manager increases (analysisd)
- Disk I/O pressure increases on the Indexer
- Memory usage grows due to buffering and processing queues
Practical Guidelines
While exact limits depend on hardware and tuning, general observations are:
- < 100 EPS → All-in-One deployment is usually sufficient
- 100–1000 EPS → Distributed deployment recommended
1000 EPS → Cluster deployment required
Signs You Need to Scale
You should consider scaling your deployment if you notice:
- delayed alert generation
- high CPU usage on the Manager
- slow queries in the Dashboard
- event queue buildup or dropped events
Key Insight
Scaling in Wazuh is not triggered by the number of agents alone.
It is driven by:
- event volume (EPS)
- log verbosity
- detection complexity
Understanding this helps you avoid underestimating infrastructure requirements.
6. Choosing the Learning Path
At this point, we have covered:
- Wazuh architecture and data flow
- Core components and how they operate
- Deployment models and their trade-offs
The next step is deciding which deployment model to actually use for learning and hands-on practice.
Why We Start with All-in-One
For this series, we will use the All-in-One deployment model.
This means running:
- Wazuh Manager
- Wazuh Indexer
- Wazuh Dashboard
on a single machine.
Reasoning Behind This Choice
The goal at this stage is not building a production-ready SOC.
The goal is to:
- understand how the system works internally
- learn how to configure agents and rules
- build detection use cases
- interact with alerts and logs
The All-in-One model provides:
- a simplified environment
- faster setup
- easier troubleshooting
- full visibility into all components in one place
What About Distributed and Cluster?
More advanced deployment models such as:
- Distributed deployments
- Clustered environments
are essential for production use.
However, they introduce additional complexity, including:
- multi-node coordination
- load balancing
- high availability design
For this reason, they will be covered later in the series once the fundamentals are fully understood.
Learning Strategy
The approach for this series is:
- Start with All-in-One (lab environment)
- Build detection and analysis skills
- Understand system limitations
- Move to Distributed / Cluster when scaling is required
7. Lab Setup & Installation (Ubuntu Server)
In this section, we will install Wazuh using the All-in-One deployment on Ubuntu Server.
This setup includes:
- Wazuh Manager
- Wazuh Indexer
- Wazuh Dashboard
Step 1: Update the System
1
sudo apt update && sudo apt upgrade -y
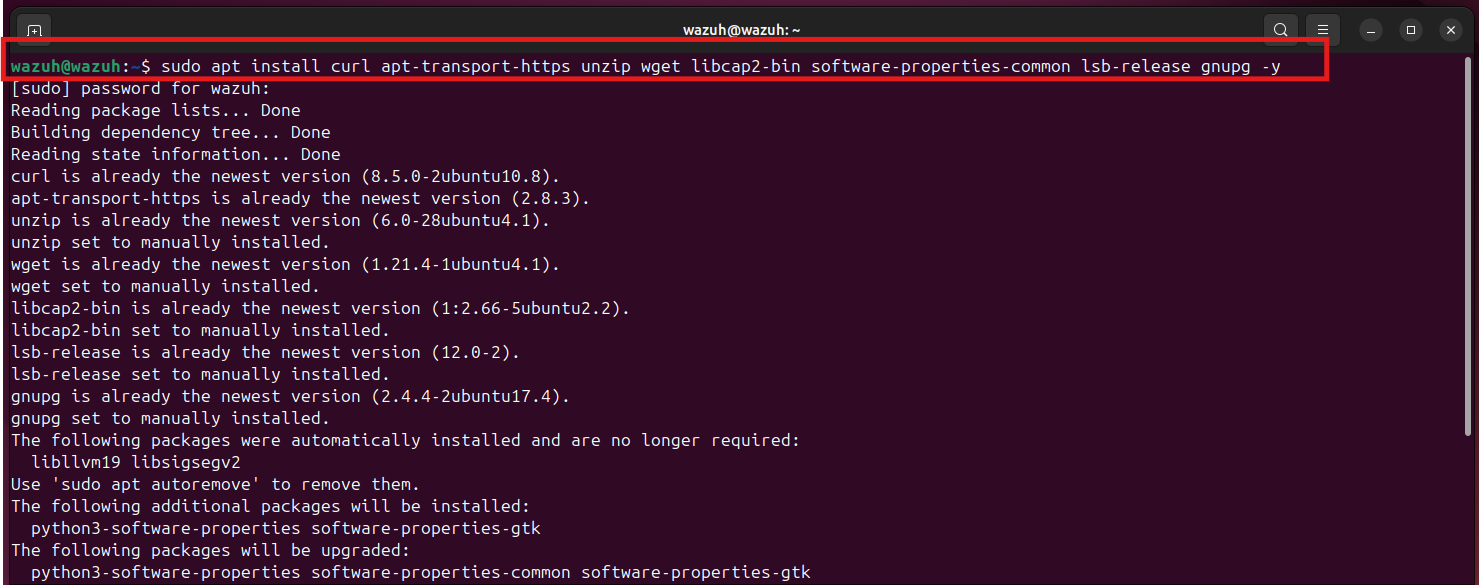
Step 2: Install Required Dependencies
1
sudo apt install curl apt-transport-https unzip wget libcap2-bin software-properties-common lsb-release gnupg -y
Step 3: Download the Wazuh Installer
1
curl -sO https://packages.wazuh.com/4.14/wazuh-install.sh
Step 4: Run the Installation (All-in-One)
1
sudo bash wazuh-install.sh -a
This command will:
- Install Wazuh Manager
- Install Wazuh Indexer
- Install Wazuh Dashboard
- Configure everything automatically
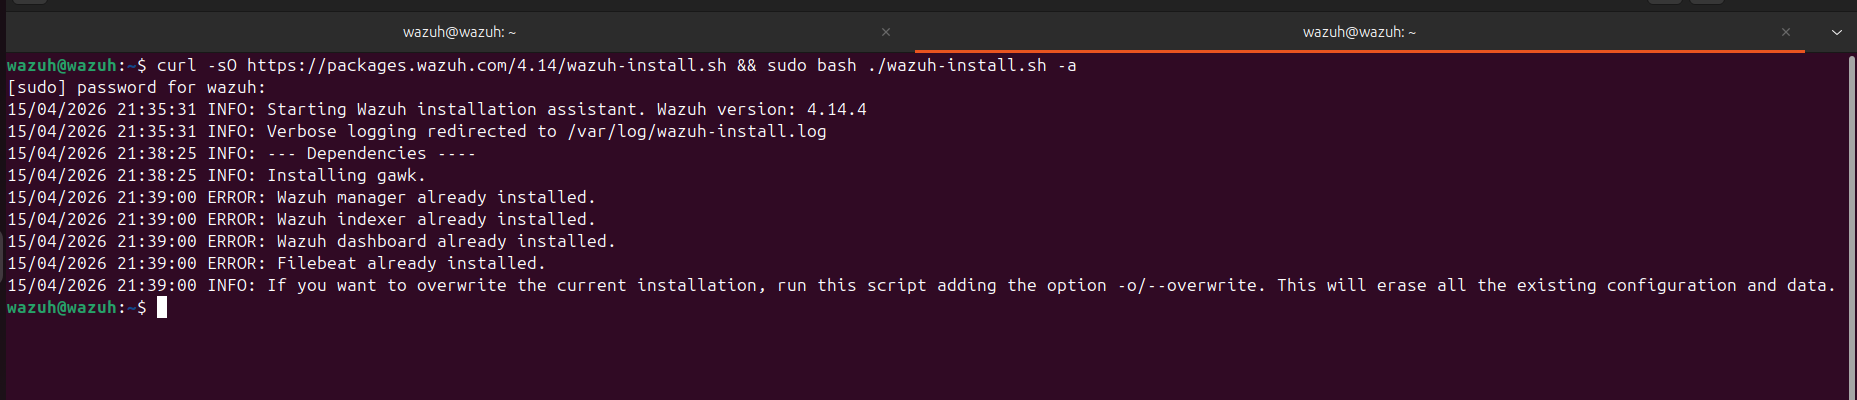
Note (Already Installed Case)
In my case, the installer returned messages like:
Wazuh manager already installed
Wazuh indexer already installed
Wazuh dashboard already installed
This happened because Wazuh was already installed on my system from a previous setup.
So instead of reinstalling, the script simply detected the existing installation and stopped.
This is normal behavior and not an error.
Step 5: Access the Dashboard
Open your browser and go to:
https://
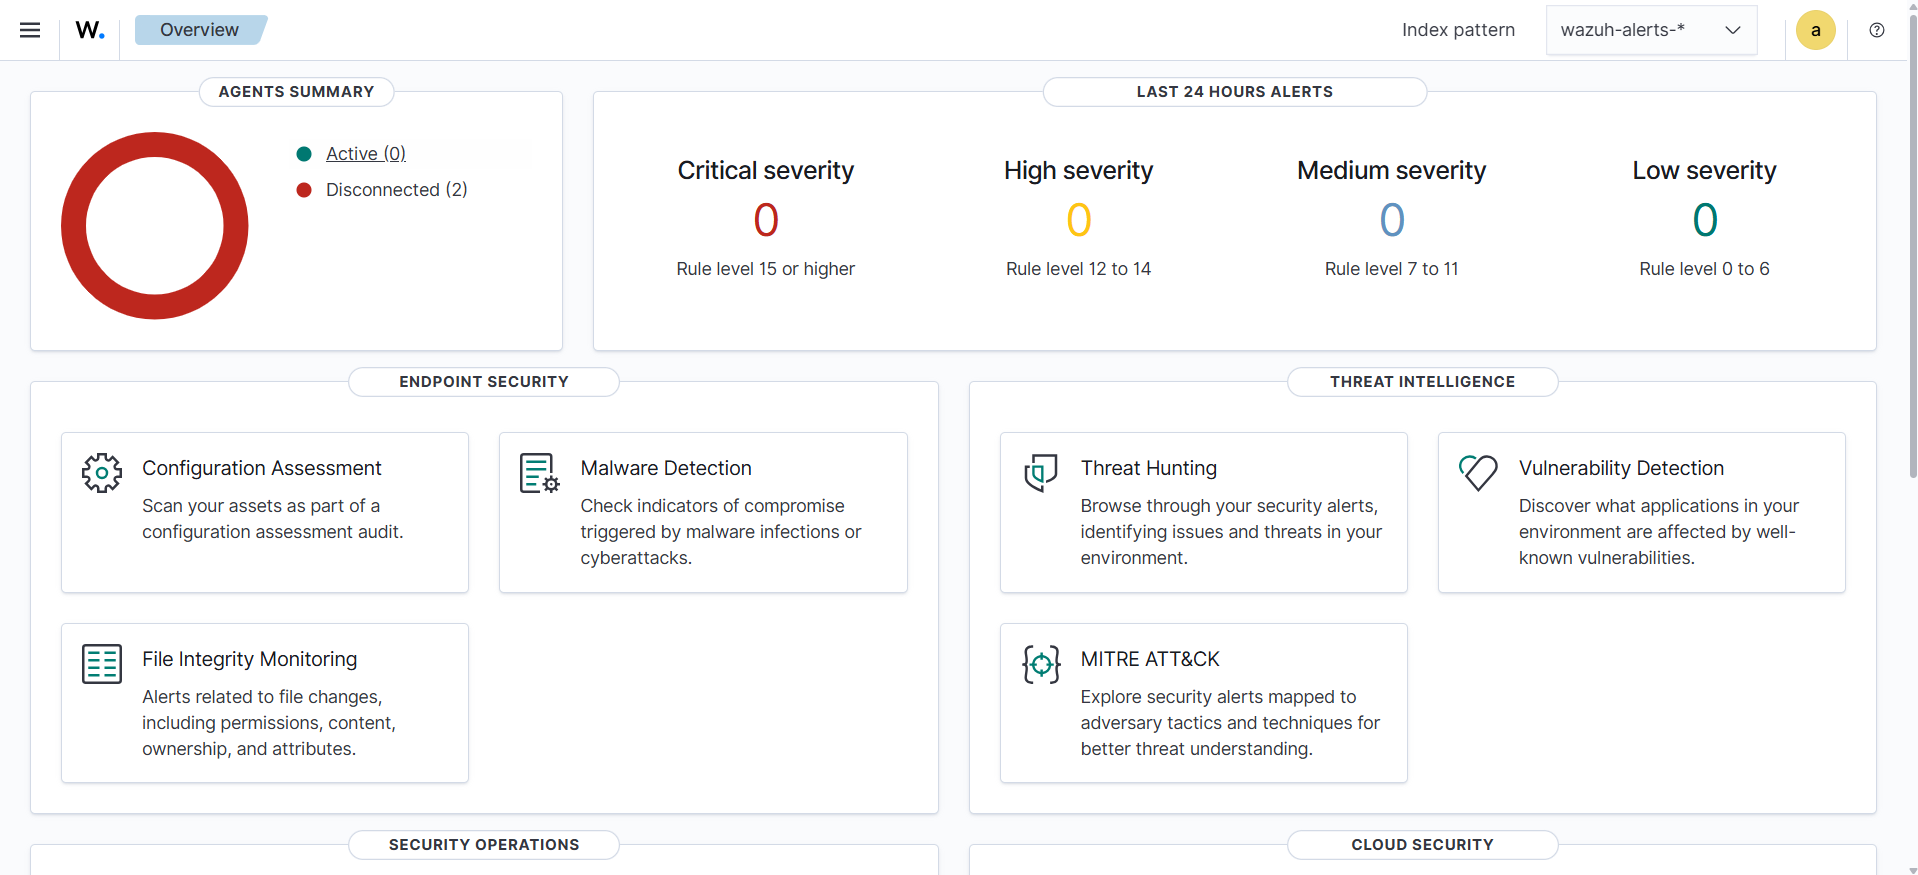
Verification
After logging in:
- Dashboard loads correctly
- No critical errors
- System is ready to receive agents
What’s Next
At this stage, Wazuh is installed and operational, but it is not yet monitoring any systems.
In Part 2 of this series:
Wazuh Agent & Manager – The Heart of the SOC
We will move into the core operational layer of Wazuh, focusing on how data is actually collected, processed, and turned into detections.
This includes:
- Agent installation (Windows, Linux, macOS)
- Agent enrollment, grouping, and centralized configuration
- Manager internals (
ossec.conf, decoders, rules) - Log forwarding and active response mechanisms
- Best practices (Sysmon integration, performance tuning)
We will also use real examples from the lab environment, including:
- Windows agent with Sysmon integration
- DVWA (Linux) agent for web attack monitoring
This is where Wazuh transitions from a deployed system into a functional SOC platform.